How to Enhance Database Performance Testing Using Custom SQL Scripts in PgBench
April 25, 2024
pgbench is a popular tool for testing database performance, but it’s default ‘TPC-B like’ workload, which involves many roundtrips and context switches, may not effectively reflect true performance as it could skew results. To overcome this, users can employ custom SQL within pgbench to design a load test that more accurately simulates real-world scenarios and identifies potential bottlenecks.
This applies to PostgreSQL and Postgres-compatible databases. I’ll demo on YugabyteDB. You can skip to “Step 3: Create the schema” if you already have a database.
#1: Start a YugabyteDB cluster
To begin, I will use my yb-compose Docker Compose configuration to start a 3 nodes cluster.
git clone https://github.com/FranckPachot/yb-compose.git
cd yb-compose
docker compose up -d
This starts a cluster with 3 nodes and replication factor 3, which you can scale further with:
docker compose up --scale yb=6 -d
Using the service I’ve declared in the docker-compose, you can connect with the PostgreSQL client from a container, or from the host through the forwarded ports. I’ll explain both.
#2a: Connect from a container
If you connect from another container, preferably from one where you can use the service name 'yb' which will connect to any node. For example, you can start a shell from the ‘pg‘ service declared in the docker-compose.yaml and set the environment to connect to the ‘yb‘ service:
docker compose run -it pg bash

  export PGLOADBALANCEHOSTS=random
  export PGUSER=yugabyte
  export PGDATABASE=yugabyte
  export PGPASSWORD=yugabyte
  export PGPORT=5433
  export PGHOST=yb
To verify, this connection will show a different address each time you run it:
psql -c "show listen_addresses"
#2b: Connect from the host via forwarded posts
If you connect through forwarded ports, you can list them with:
docker compose ps yb
You need the PostgreSQL client; I will use version 16 to utilize features like load balancing. Here is an example of installing it in Alma8, to get psql and pgbench:
sudo dnf install -y
https://download.postgresql.org/pub/repos/yum/reporpms/EL-8-x86_64/pgdg-redhat-repo-latest.noarch.rpm
sudo dnf -qy module disable postgresql
sudo dnf install -y postgresql16 jq
alias psql=/usr/pgsql-16/bin/psql
alias pgbench=/usr/pgsql-16/bin/pgbench
With jq installed, here is how I set PGHOST and PGPORT from the list of ports to enable load balancing:
export PGLOADBALANCEHOSTS=random
export PGUSER=yugabyte
export PGDATABASE=yugabyte
export PGPASSWORD=yugabyte
export PGPORT=$( docker compose ps yb --format json | jq -r '[ .[].Publishers[]|select(.TargetPort==5433)|.PublishedPort ] | join(",")' )
export PGHOST=$( echo "$PGPORT" | sed -e 's/[^,]*/localhost/g' )
set | grep ^PG
Here is an example of settings. Docker Compose assigns ports in the range defined:
-bash-4.2# set | grep ^PG
PGHOST=localhost,localhost,localhost,localhost,localhost,localhost
PGLOADBALANCEHOSTS=random
PGDATABASE=yugabyte
PGPASSWORD=yugabyte
PGUSER=yugabyte
PGPORT=5437,5438,5439,5443,5444,5441
To verify, this connection will show a different address each time you run it:
psql -c "show listen_addresses"
Now that the PostgreSQL client is ready, we can use psql and pgbench.
#3: Create the schema
Let’s create the schema we will be running. I’m setting something very simple here:
psql <<'\q'
\set ON_ERROR_STOP on
\timing on
drop table if exists demo;
create table demo (k bigint, v int, primary key(k));
insert into demo select generate_series(1,10000) k, 0 v;
\q
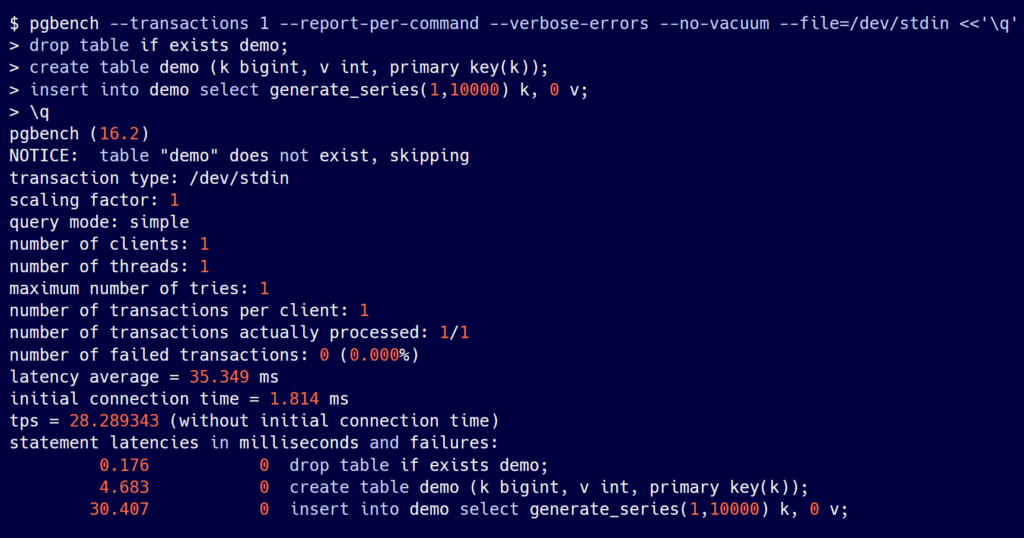
Note: You can already use PgBench to run those statements. I’ll explain the arguments later:
pgbench --transactions 1 --report-per-command --verbose-errors --no-vacuum --file=/dev/stdin <<'\q'
drop table if exists demo;
create table demo (k bigint, v int, primary key(k));
insert into demo select generate_series(1,10000) k, 0 v;
\q
Put your script in a file. I use STDIN and a HEREDOC for easy copy/paste.
An example of output:
#4: Run transactions from multiple clients
The script provided to PgBench can use some functions for example to generate random values into variables. All is documented and can be found on Postgresql.org documentation.
I will run PgBench with the following arguments:
--no-vacuum: doesn’t run vacuum on the default pgbench tables, which we don’t use there. NOTE that VACUUM is not needed in YugabyteDB
--clients: this is the number of connections to the server. With PostgreSQL client 16 and PGLOADBALANCEHOSTS=random it will open connections in a round-robin fashion to the hosts/port listed in PGHOST/PGPORT
--job: By default, those connections are opened by one pgbench thread, which probably works fine since the requests are sent asynchronously. Increasing the number of jobs distributes those connections from multiple pgbench threads. The names are misleading: --client is about the number of server processes (backend) and --job is about the number of client (application) threads.
--file=/dev/stdin: the script to run will be taken from standard input, which I provide with a bash HEREDOC, but you can use a real file of course
--transactions: the number of script executions per connection. The total number of transactions is --transactions multiplied by --clients. You may prefer to run as many transactions as can be run in a time window, with --timein seconds.
--report-per-command: shows individual latency for each statement in the script, which is important to understand which statements may need tuning.
--max-tries 5: in case of retriable error (SQLSTATE 40001 for serializable errors or 40P01 for deadlocks) pgBench can retry them and report the number of retries. It is a best practice to have a retry logic, especially in a distributed SQL database where some rare cases of clock skew may need retry, even in Read Committed isolation levels, as well as some online schema changes.
Example #1
Here is a simple example:
pgbench --client=2 --transactions=10 --max-tries 5 --report-per-command --no-vacuum --file=/dev/stdin <<'\q'
\set my_value random(1,3)
begin isolation level serializable;
select * from demo where k=:my_value;
update demo set v=v+1 where k=:my_value;
select pg_sleep(1);
commit;
\q
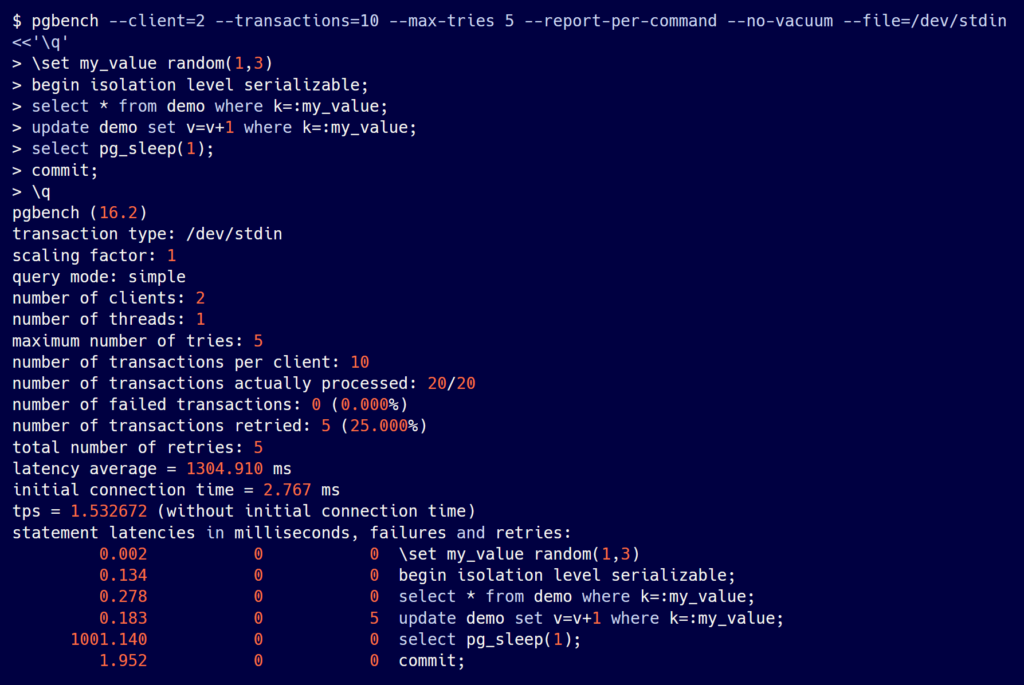
I used a serializable isolation level with a long transaction to show the retries.
Example #2
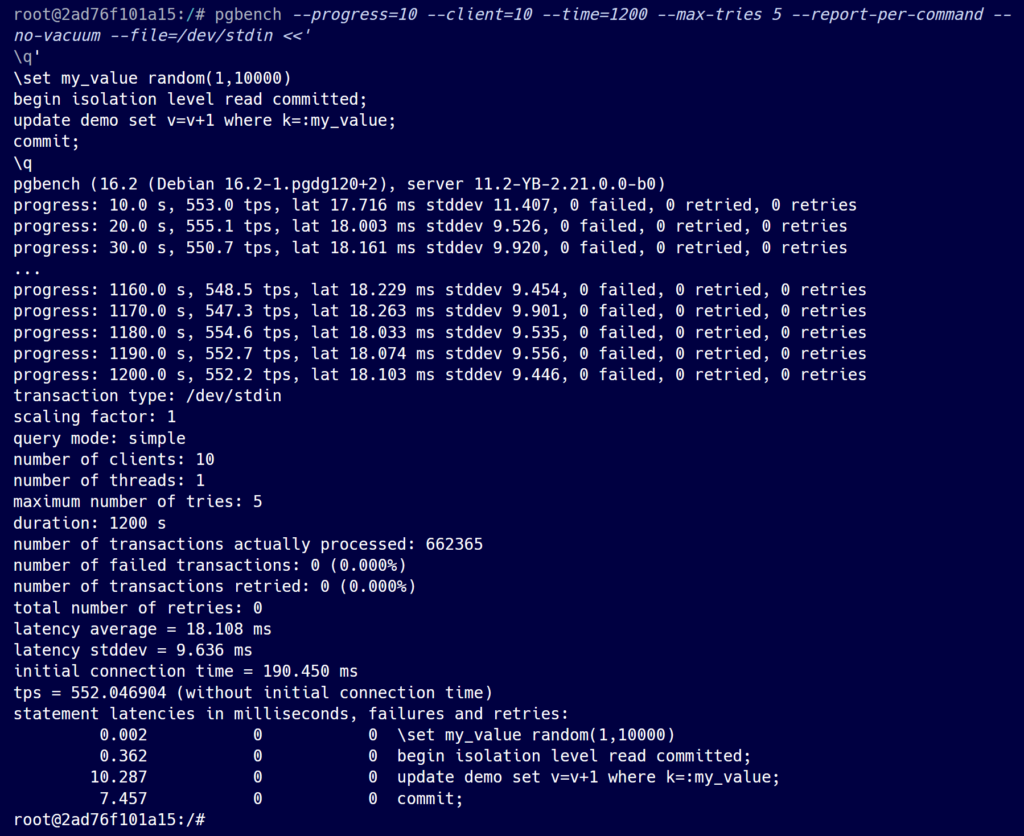
Here is another example running for 15 minutes and using prepared statements:
pgbench --progress=10 --protocol=prepared --client=10 --time=1200 --max-tries 5 --report-per-command --no-vacuum --file=/dev/stdin <<'\q'
\set my_value random(1,10000)
begin isolation level read committed;
update demo set v=v+1 where k=:my_value;
commit;
\q
The load is well-balanced across the three nodes:

I’ve added the --progress=10 option that displays the statistics every 10 seconds:
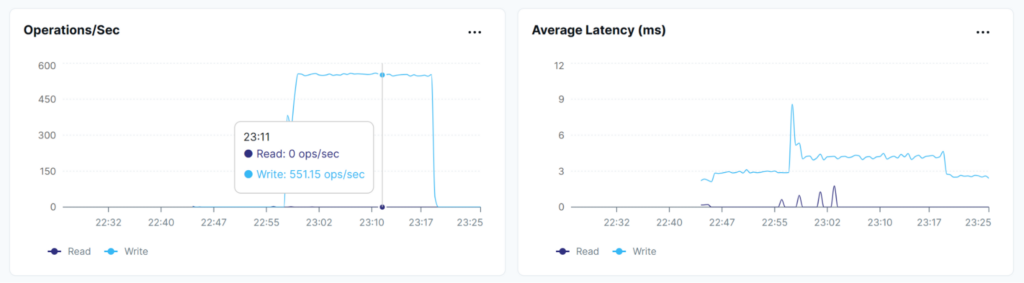
Since those are single statement transactions, the transaction per second (tps) reported by pgbench matches the distributed write operations per second (ops/s) reported by YugabyteDB:
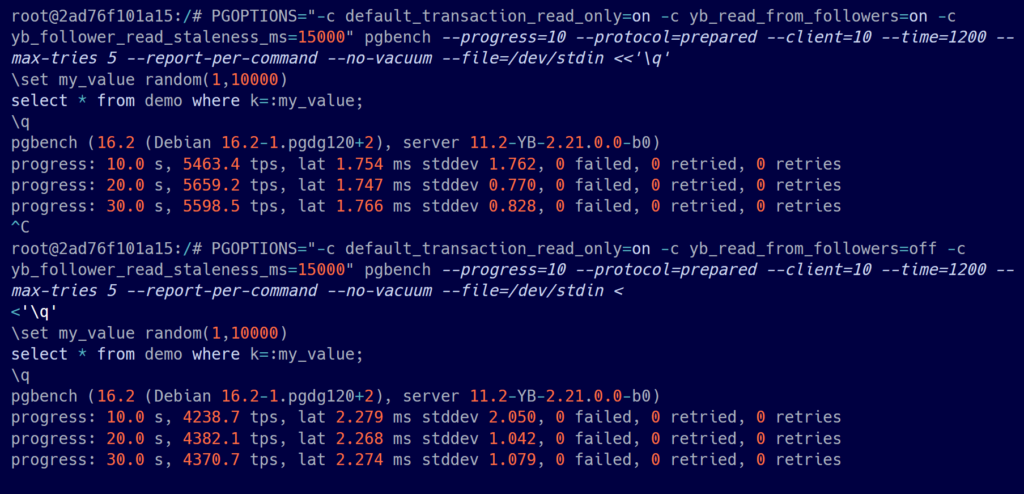
To set YSQL session options, you can use PGOPTIONS, like in this example, to allow reads for Raft followers in read-only transactions:
PGOPTIONS="-c default_transaction_read_only=on -c yb_read_from_followers=on -c yb_follower_read_staleness_ms=15000" pgbench --progress=10 --protocol=prepared --client=10 --time=1200 --max-tries 5 --report-per-command --no-vacuum --file=/dev/stdin <<'\q'
\set my_value random(1,10000)
select * from demo where k=:my_value;
\q
Example #3
Here is an example comparing yb_read_from_followers set to on (5500 reads per second at 1.7 milliseconds) and set to off (4230 reads per second at 2.2 milliseconds):
Before interpreting any benchmark result, it’s important to fully understand the data and verify it against different metrics across different layers. For example, I compared the transactions accounted for by the client and the write operations accounted for by the database. During a database stress test, especially with distributed SQL databases, ensure that the correct resources are being stressed and that the workload is evenly distributed, as demonstrated by monitoring CPU usage.


