Solving PostgreSQL Indexes, Partitioning, and LockManager Limitations
March 26, 2024
2023 has been referred to as “The Year of the Lock Manager’s Revenge” in a recent article that examined production challenges related to queries across multiple partitions and indexes. Kyle Hailey, who has extensive Oracle Database and performance troubleshooting experience, documented one such issue at Midjourney, highlighting how surprised he was by PostgreSQL’s limitations. PostgreSQL’s partitioning is implemented on top of tables, much like inheritance and views. This results in too many partitions presenting the same types of problems as querying too many tables and indexes.
In two additional blog posts, he offers valuable insights into PostgreSQL partitioning challenges and scalability issues compared to Oracle Database.
Optimizing the Management of Large Data Sets in PostgreSQL
Managing terabyte-sized tables in PostgreSQL can be complex. Partitioning the data is a solution, but having hundreds of partitions—which are similar to tables—makes querying impractical.
Although YugabyteDB shares a few of PostgreSQL’s limitations, it enhances scalability with its underlying storage. It distributes table rows and index entries, reducing the reliance on declarative partitioning.*
*NOTE: Declarative partitioning remains useful in YugabyteDB for, say, purging old data and ensuring data sovereignty, where managing tens of partitions is acceptable. When it comes to scaling both horizontally and linearly, YugabyteDB automatically and transparently splits and distributes data across partitions, optimizing reads and writes.
In this article, I’ll run two demos:
- On PostgreSQL with declarative partitioning and Lock Manager Contention, highlighting some of the limitations
- On YugabyteDB, which has distributed tables, indexes, and linear scalability.
PostgreSQL With Declarative Partitioning and LockManager Contention
To summarize the main problem, I created a table in PostgreSQL with a hundred partitions:
CREATE TABLE payments_part (
       primary key (payment_id)
     , payment_id bigint generated always as identity (cache 1000)
     , created timestamptz not null default now()
     , account_id bigint not null
     , amount decimal(10,2) not null
) partition by hash (payment_id)
;

-- generate the partition DDL and \gexec it.
select format('create  table %I partition of %I for values with ( modulus %s, remainder %s)'
 , 'payments_'||to_char(num,'FM099') , 'payments_part'
 , max(num)over(), num-1
) from generate_series(1,100) num
;
\gexec

create index payments_by_account_part on payments_part(account_id, amount desc);

vacuum analyze payments_part;
While it is not necessary to demonstrate the problem, let’s add a hundred million rows to provide a practical example to work with.
insert into payments_part (account_id, amount, created)
 select 1000 * random() as account, random() as amount,
 random() * interval '24.25 year' + timestamp '2000-01-01 00:00:00' as created
 from generate_series(1,100000) account_id
\watch c=1000
vacuum analyze payments_part;
The problem is evident in the execution plan for a basic query. Because indexes are local, the query performs a hundred Index Scans and concatenates the results.
postgres=> explain (analyze, buffers, costs off)
                       select * from payments_part
                       where account_id = 42 and amount < 0.01
;
                                            QUERY PLAN
-----------------------------------------------------------------------------------------
 Append (actual time=0.014..1.018 rows=495 loops=1)
   Buffers: shared hit=797
   ->  Index Scan using payments_001_account_id_amount_idx on payments_001 (actual time=0.013..0.018 rows=5 loops=1)
         Index Cond: ((account_id = 42) AND (amount < 0.01))
         Buffers: shared hit=8
   ->  Index Scan using payments_002_account_id_amount_idx on payments_002 (actual time=0.007..0.008 rows=1 loops=1)
         Index Cond: ((account_id = 42) AND (amount < 0.01))
         Buffers: shared hit=4
... (for the 100 of partitions)
   ->  Index Scan using payments_099_account_id_amount_idx on payments_099 (actual time=0.005..0.008 rows=4 loops=1)
         Index Cond: ((account_id = 42) AND (amount < 0.01))
         Buffers: shared hit=7
   ->  Index Scan using payments_100_account_id_amount_idx on payments_100 (actual time=0.006..0.009 rows=4 loops=1)
         Index Cond: ((account_id = 42) AND (amount < 0.01))
         Buffers: shared hit=7
 Planning Time: 2.645 ms
 Execution Time: 1.415 ms
(304 rows)
In addition to the cost of going through a hundred B-Tree levels, the execution plan is huge. Even at the time of execution, some locks must be acquired in shared memory structures, and this limits the scalability.
Here’s an execution plan for a simple query retrieving the maximum amount for one account:
postgres=> explain (analyze, buffers, costs off, summary off )
          select max(amount) from payments_part
                       where account_id = 42
;

                                                               QUERY PLAN
----------------------------------------------------------------------------------------------------------------------------------------
 Result (actual time=1.526..1.549 rows=1 loops=1)
   Buffers: shared hit=401
   InitPlan 1 (returns $0)
     ->  Limit (actual time=1.521..1.545 rows=1 loops=1)
           Buffers: shared hit=401
           ->  Merge Append (actual time=1.520..1.543 rows=1 loops=1)
                 Sort Key: payments_001.amount DESC
                 Buffers: shared hit=401
                 ->  Index Only Scan using payments_001_account_id_amount_idx on payments_001 (actual time=0.026..0.027 rows=1 loops=1)
                       Index Cond: ((account_id = 42) AND (amount IS NOT NULL))
                       Heap Fetches: 0
                       Buffers: shared hit=4
... (for the 100 of partitions)
       -> Index Only Scan using payments_100_account_id_amount_idx on payments_100 (actual time=0.016..0.016 rows=1 loops=1)
          Index Cond: ((account_id = 42) AND (amount IS NOT NULL))
          Heap Fetches: 0
          Buffers: shared hit=4
Even with quick response times, reading the first row from each index partition makes a plan that reads one hundred table partitions unscalable, especially when concurrent executions will compete on the lock manager.
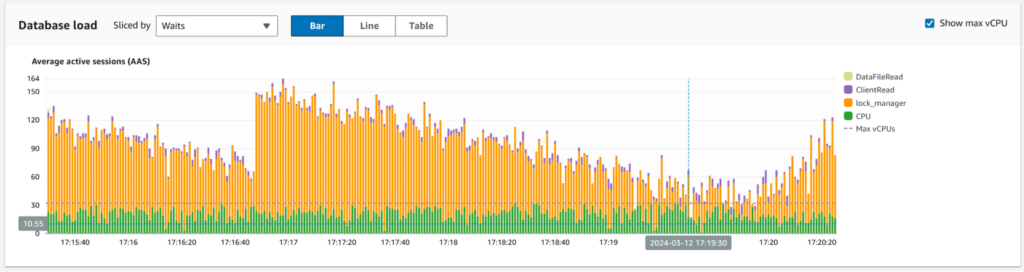
Therefore, I used PgBench to run this query from two hundreds client sessions:
cat > query.sql <<'SQL'
\set id random(1,1000)
select max(amount) from payments_part where account_id = :id;
SQL
pgbench -c 200 -T 300 -nf query.sql -M prepared -r
During the run, wait events indicate that sessions devote approximately one-third of their execution time to waiting for locks.
The latency metrics from the PgBench client is not helpful since the client-server round trip consumes the majority of the time. However, the throughput gives an idea of the performance:
[ec2-user@ip-172-31-33-218 postgresql-16.2]$ cat > query.sql <<'SQL'
\set id random(1,1000)
select max(amount) from payments_part where account_id = :id;
SQL
pgbench -c 200 -T 300 -nf query.sql -M prepared -r
pgbench (16.2, server 11.22)
transaction type: query.sql
scaling factor: 1
query mode: prepared
number of clients: 200
number of threads: 1
maximum number of tries: 1
duration: 300 s
number of transactions actually processed: 2348934
number of failed transactions: 0 (0.000%)
latency average = 25.369 ms
initial connection time = 2078.371 ms
tps = 7883.760582 (without initial connection time)
statement latencies in milliseconds and failures:
         0.001           0  \set id random(1,1000)
        24.580           0  select max(amount) from payments_part where account_id = :id;
[ec2-user@ip-172-31-33-218 postgresql-16.2]$
Response time and latency are visible from pg_stat_statements, revealing 6407 transactions per second with an average execution time of 1.45 milliseconds:
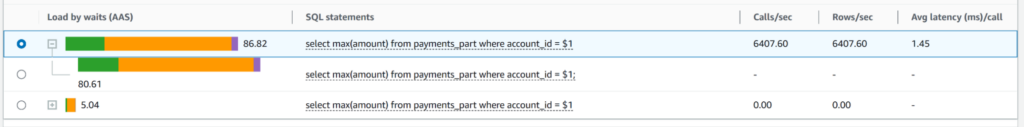
I have run this on AWS db.m5.8xlarge multi-AZ ( 2x 32 vCPUs, 128 GiB ) managed by Amazon RDS. Adding more CPU would not help because most of the time is spent on lock manager contention.
YugabyteDB With Distributed Tables and Indexes to Scale
Performing the same operation as above with YugabyteDB, with a hundred tables, is feasible but lacks scalability. The reason is different: YugabyteDB doesn’t need to acquire shared locks on a central memory structure. However, its deployment across multiple availability zones means that sending read operations to numerous partitions will introduce network latency for each partition.
To distribute data, utilize the storage’s automatic sharding. Distributed reads scale by batching the operations, incurring latency only once per execution, typically a millisecond in a single-region deployment. It also provides all SQL agility without limitations: global secondary indexes and referential integrity. It is also easier since the tablets are split automatically as the table grows.
Suppose I want the equivalent of 100 partitions. In that case, I simply add “split into 100 tablets” to my CREATE TABLE statement:
CREATE TABLE payments (
       primary key (payment_id)
     , payment_id bigint generated always as identity (cache 1000)
     , created timestamptz not null default now()
     , account_id bigint not null
     , amount decimal(10,2) not null
) split into 100 tablets
;
If I load 8TB of data into this table, each tablet will be approximately 80GB, ideal for avoiding lengthy and expensive operations. If I add new nodes to my cluster, the tablet peers will automatically move to balance the node, with the tablet as the unit of adjustment. Full compaction, if needed, will occur tablet by tablet. A cluster can run hundreds of tablets per node.
I don’t need to manually set the number of tablets. They will split automatically according to their size and the number of nodes in the cluster. I did it here to demonstrate the executions with a level of partitioning comparable to what I did in the PostgreSQL demo.
I can create any index without limitations on the key because all indexes are globally distributed. Here is an index I created for quick access to the payments from one account:
create index payments_by_account on payments(account_id, amount desc)
  split into 100 tablets
;
In general, you can create more secondary indexes in YugabyteDB than in PostgreSQL because neither have the same performance overhead.
I generate the same amount of data:
insert into payments (account_id, amount, created)
 select 1000 * random() as account, random() as amount,
 random() * interval '24.25 year' + timestamp '2000-01-01 00:00:00' as created
 from generate_series(1,100000) account_id
\watch c=1000
I have 100 million rows distributed into 100 table’s tablets and 100 index’s tablets over 3 availability zones.
yugabyte=> select count(*) from payments ;

   count
-----------
 100000000

(1 row)

yugabyte=> select num_tablets from yb_table_properties('payments'::regclass);

 num_tablets
-------------
         100

(1 row)

yugabyte=> select num_tablets from yb_table_properties('payments_by_account'::regclass);

 num_tablets
-------------
         100

(1 row)

yugabyte=> select host, cloud, region, zone from yb_servers() order by 2,3,4;

    host     | cloud |  region   |    zone
-------------+-------+-----------+------------
 10.8.8.142  | aws   | eu-west-1 | eu-west-1a
 10.8.9.141  | aws   | eu-west-1 | eu-west-1a
 10.8.8.5    | aws   | eu-west-1 | eu-west-1a
 10.8.11.120 | aws   | eu-west-1 | eu-west-1b
 10.8.10.34  | aws   | eu-west-1 | eu-west-1b
 10.8.11.158 | aws   | eu-west-1 | eu-west-1b
 10.8.12.201 | aws   | eu-west-1 | eu-west-1c
 10.8.12.82  | aws   | eu-west-1 | eu-west-1c
 10.8.13.34  | aws   | eu-west-1 | eu-west-1c

(9 rows)
The key insight into scalability comes from the execution plan. Here is a query that retrieves all payments from an account with a payment amount lower than one cent:
yugabyte=> explain (analyze, dist, costs off)
                       select * from payments
           where account_id = 42 and amount < 0.01
;
                                            QUERY PLAN
-----------------------------------------------------------------------------------------
 Index Scan using payments_by_account on payments (actual time=6.755..7.013 rows=500 loops=1)
   Index Cond: ((account_id = 42) AND (amount < 0.01))
   Storage Table Read Requests: 1
   Storage Table Read Execution Time: 4.420 ms
   Storage Index Read Requests: 1
   Storage Index Read Execution Time: 1.908 ms
 Planning Time: 0.064 ms
 Execution Time: 7.082 ms
 Storage Read Requests: 2
 Storage Read Execution Time: 6.328 ms
 Storage Write Requests: 0
 Catalog Read Requests: 0
 Catalog Write Requests: 0
 Storage Flush Requests: 0
 Storage Execution Time: 6.328 ms
 Peak Memory Usage: 8 kB
(16 rows)
This execution plan does not concatenate partitions, preventing contention on the lock manager in PostgreSQL. It is a single table in the SQL layer. The read requests to the index and the table are batched and sent to all nodes, where rows and index entries are distributed to tablets. Fetching the result of 500 rows from the distributed storage (in multiple availability zones) in 7 milliseconds.
Because the indexes are global, they are very efficient, especially when covering all columns required by the query. Here is a query that retrieves the payment amount for a list of accounts.
yugabyte=> explain (analyze, dist, costs off)
                      select amount from payments
          where account_id in (1,12,42,68,102,500,746,909)
          and amount < 0.01
          order by amount
;

                                                   QUERY PLAN
-----------------------------------------------------------------------------------------
 Sort (actual time=5.222..5.341 rows=3967 loops=1)
   Sort Key: amount
   Sort Method: quicksort  Memory: 282kB
   ->  Index Only Scan using payments_by_account on payments (actual time=2.852..4.538 rows=3967 loops=1)
         Index Cond: ((account_id = ANY ('{1,12,42,68,102,500,746,909}'::bigint[])) AND (amount < 0.01))
         Heap Fetches: 0
         Storage Index Read Requests: 1
         Storage Index Read Execution Time: 2.673 ms
 Planning Time: 0.093 ms
 Execution Time: 5.526 ms
 Storage Read Requests: 1
 Storage Read Execution Time: 2.673 ms
 Storage Write Requests: 0
 Catalog Read Requests: 0
 Catalog Write Requests: 0
 Storage Flush Requests: 0
 Storage Execution Time: 2.673 ms
 Peak Memory Usage: 508 kB
(18 rows)
The result is returned in 5 milliseconds, which is typically unattainable with a PostgreSQL table partitioned on payment_id because it necessitates reading all partitions, in this case, 100 indexes. However, YugabyteDB reads many tablets in a single distributed read request. Additionally, thanks to YugabyteDB’s loose index scan, it’s capable of reading for multiple values in a single request.
Note that I didn’t need to VACUUM to get a real Index Only Scan (with Heap Fetches: 0). YugabyteDB implements multi-version concurrency control in tables and indexes, eliminating the need to go to the table rows, or their visibility map, for consistent reads.
Here is the execution plan for the simple query that I’ll run concurrently:
yugabyte=> explain (analyze, dist, costs off, summary off )
          select max(amount) from payments where account_id = 42
;
                                                  QUERY PLAN
-----------------------------------------------------------------------------------------
 Result (actual time=1.151..1.152 rows=1 loops=1)
   InitPlan 1 (returns $0)
     ->  Limit (actual time=1.148..1.149 rows=1 loops=1)
           ->  Index Only Scan using payments_by_account on payments (actual time=1.147..1.147 rows=1 loops=1)
                 Index Cond: ((account_id = 42) AND (amount IS NOT NULL))
                 Heap Fetches: 0
                 Storage Index Read Requests: 1
                 Storage Index Read Execution Time: 1.038 ms
(8 rows)
I use PgBench to run it from one hundred concurrent sessions:
cat > query.sql <<'SQL'
\set id random(1,1000)
select max(amount) from payments where account_id = :id;
SQL
pgbench -c 200 -T 300 -nf query.sql -M prepared -r
The throughput is 9707 transactions per second:
[ec2-user@ip-172-31-33-218 postgresql-16.2]$ cat > query.sql <<'SQL'
\set id random(1,1000)
select max(amount) from payments where account_id = :id;
SQL
pgbench -c 200 -T 300 -nf query.sql -M prepared -r
pgbench (16.2, server 11.2-YB-2.18.6.0-b0)
transaction type: query.sql
scaling factor: 1
query mode: prepared
number of clients: 200
number of threads: 1
maximum number of tries: 1
duration: 300 s
number of transactions actually processed: 2807877
number of failed transactions: 0 (0.000%)
latency average = 20.614 ms
initial connection time = 10623.820 ms
tps = 9702.109724 (without initial connection time)
statement latencies in milliseconds and failures:
         0.001           0  \set id random(1,1000)
        19.536           0  select max(amount) from payments where account_id = :id;
[ec2-user@ip-172-31-33-218 postgresql-16.2]$
The average response time is 1.62 milliseconds:

I have run this on AWS m6i.xlarge Replication Factor 3 ( 9x 4 vCPUs, 16 GiB ) managed by YugabyteDB, which is resilient to zone failure. There’s no lock manager and no single point of contention. It can scale by adding new nodes, and the tablets will be automatically rebalanced.
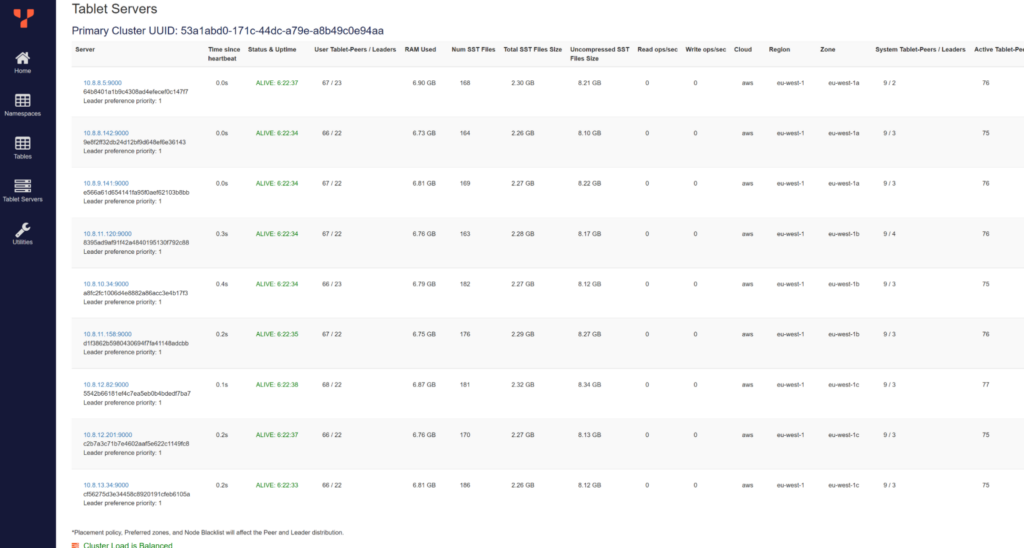
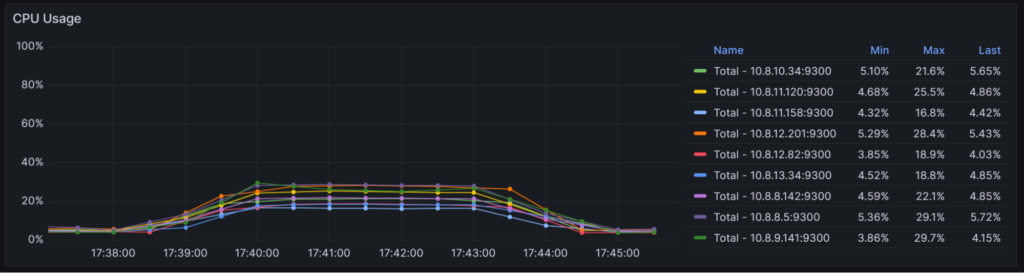
I can check that the 200 tablets (100 for the table and 100 for the secondary index) are well-distributed, with 22 Raft leaders on each node and two Raft followers in other zones:
YugabyteDB Metrics
I’ve run this on Yugabyte’s fully-managed DBaaS, YugabyteDB Managed, where you can explore the performance metrics in Grafana or Datadog. Since all nodes are active, I connected through the load balancer and can verify that the connections were distributed to all nodes:
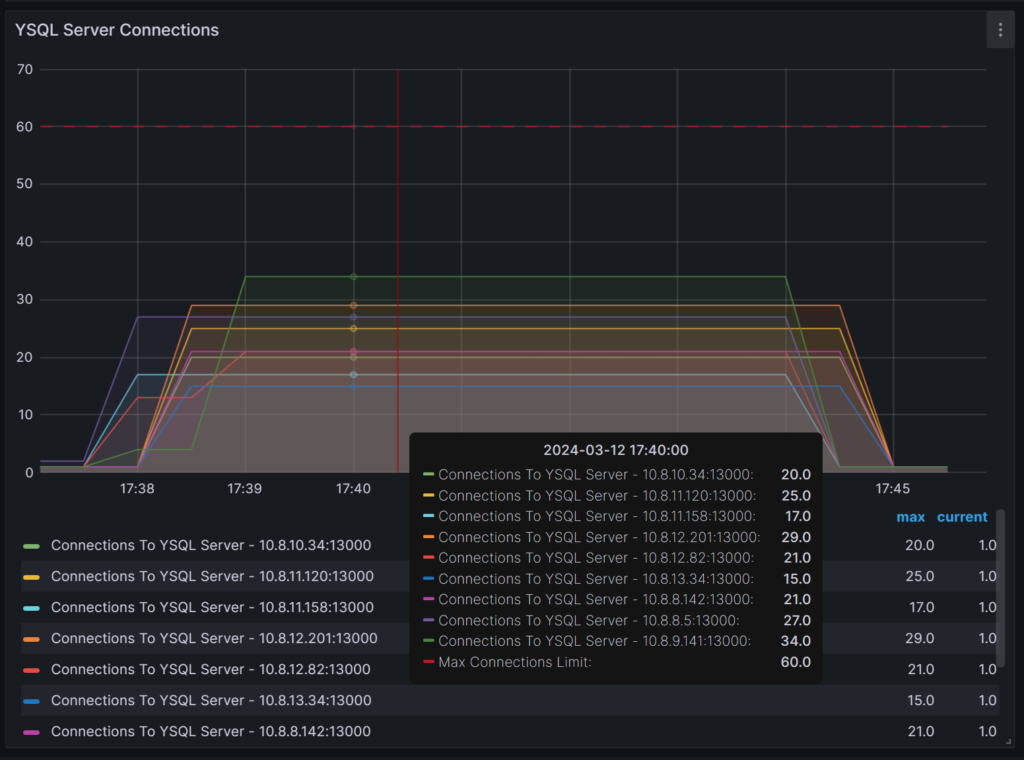
SQL processing is well-balanced, and it’s evident that my cluster can handle increased throughput:
The SQL Select is transformed to distributed read operations that are also distributed to all nodes:
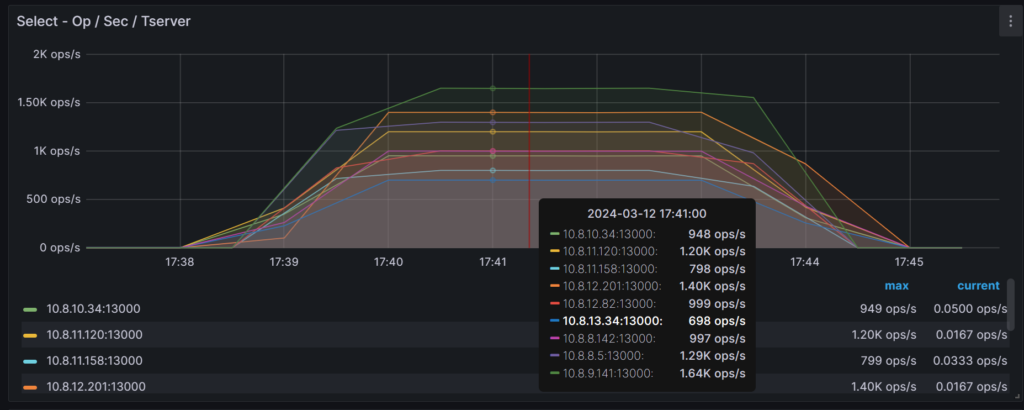
I highlighted these basic metrics to illustrate that YugabyteDB extends beyond data partitioning. All layers —connections, SQL processing, and data storage, reads and writes — are distributed.
In Conclusion….Partitioning Levels in YugabyteDB
If your PostgreSQL database grows to terabytes, consider partitioning into multiple tables or sharding across multiple databases, especially if all access patterns can utilize a single partitioning key for all indexes.
To scale further without changing the application, migrating to YugabyteDB is a good option. If you do, try not to use many SQL partitions as in PostgreSQL and instead rely on the built-in distribution for simplified operations and faster execution.
There are two levels of partitioning in YugabyteDB:
- DocDB automatic sharding, which transparently distributes and replicates table rows and index entries, by range or hash on their key
- YSQL declarative partitioning, which enables data isolation by location (data residency and geo-distribution) or time (lifecycle management by deleting old partitions) using PostgreSQL list or range partitioning.
Those two levels can be combined, with each SQL partition distributed within the data placement constraints defined by the partition’s tablespace.
Additional Resources
- Postgres Partition Conversion: minimal downtime (https://www.kylehailey.com/post/postgres-partition-conversion-minimal-downtime) explains how difficult it is to partition an existing non-partitioned table and the limitations that change your primary key and indexing possibilities
- Postgres Partition Pains – LockManager Waits (https://www.kylehailey.com/post/postgres-partition-pains-lockmanager-waits) explains that queries on many partitions do not scale because they compete on lock acquisition at execution time.


