Monitoring YugabyteDB in Kubernetes with the Prometheus Operator and Grafana
This blog post is written by guest author Bhavin Gandhi, Software Engineer at InfraCloud Technologies, Inc. InfraCloud helps startups, SMBs, and enterprises scale by adopting cloud-native technologies.
Using the Prometheus Operator has become a common choice when it comes to running Prometheus in a Kubernetes cluster. It can manage Prometheus and Alertmanager for us with the help of CRDs in Kubernetes. The kube-prometheus-stack Helm chart (formerly known as prometheus-operator) comes with Grafana, node_exporter, and more out of the box.
In a previous blog post about Prometheus, we took a look at setting up Prometheus and Grafana using manifest files. We also explored a few of the metrics exposed by YugabyteDB. In this post, we will be setting up Prometheus and Grafana using the kube-prometheus-stack chart. And we will configure Prometheus to scrape YugabyteDB pods. At the end we will take a look at the YugabyteDB Grafana dashboard that can be used to visualize all the collected metrics.
Summary of sections in this post
- Before we begin
- Installing the Prometheus Operator
- Installing and scraping YugabyteDB
- Accessing the Grafana dashboard
- Running client workload
- (Optional) Cleaning up the resources
- Conclusion
Before we begin
Before we get started with the setup, make sure you have a Kubernetes 1.16+ cluster with kubectl pointing to it. You can create a GKE cluster or an equivalent in other cloud providers or use Minikube to create a local cluster.
We will be using Helm 3 to install the charts, make sure you have it installed on your machine as well.
Installing the Prometheus Operator
The kube-prometheus-stack Helm chart installs the required CRDs as well as the operator itself. The chart creates instances of Prometheus and Alertmanager, which are the custom resources managed by the operator.
It also comes with a set of components which one would expect to have while setting up monitoring in a Kubernetes cluster. These components include: node_exporter for collecting node level metrics, kube-state-metrics which exposes Kubernetes related metrics, and Grafana for visualizing the metrics collected by Prometheus. The chart also comes with default Grafana dashboards and Prometheus alerts.
To setup Helm with the prometheus-community and yugabytedb repositories, run the following command:
$ helm repo add prometheus-community https://prometheus-community.github.io/helm-charts
"prometheus-community" has been added to your repositories

$ helm repo add yugabytedb https://charts.yugabyte.com
"yugabytedb" has been added to your repositories

$ helm repo update
Hang tight while we grab the latest from your chart repositories...
...Successfully got an update from the "yugabytedb" chart repository
...Successfully got an update from the "prometheus-community" chart repository
Update Complete. ⎈ Happy Helming!⎈
To create a values file for kube-prometheus-stack, execute:
cat <<EOF > kube-prom-stack-values.yaml
grafana:
  dashboardProviders:
    dashboardproviders.yaml:
      apiVersion: 1
      providers:
      - name: 'default'
        orgId: 1
        folder: ''
        type: file
        disableDeletion: false
        editable: true
        options:
          path: /var/lib/grafana/dashboards/default

  dashboards:
    default:
      yugabytedb:
        url: https://raw.githubusercontent.com/yugabyte/yugabyte-db/master/cloud/grafana/YugabyteDB.json
EOF
The above kube-prom-stack-values.yaml file tells Grafana to import the YugabyteDB dashboard from the given GitHub URL.
Now we will create a namespace and install kube-prometheus-stack in it.
$ kubectl create namespace monitoring
namespace/monitoring created

$ helm install prom prometheus-community/kube-prometheus-stack \
    --namespace monitoring \
    --values kube-prom-stack-values.yaml
To check if all the components are running fine, check the status of pods from the monitoring namespace.
$ kubectl get pods --namespace monitoring
NOTE: To keep things simple, we are not providing any other options to the Helm chart. Make sure you go through the README of kube-prometheus-stack and grafana chart to explore other options that you may need.
Installing and scraping YugabyteDB
With the monitoring setup done, let’s install the YugabyteDB Helm chart. It will install YugabyteDB and configure Prometheus to scrape (collect) the metrics from our pods. It uses the ServiceMonitor Custom Resource (CR) to achieve that.
To create a namespace and install the chart, run the following command:
$ kubectl create namespace yb-demo
namespace/yb-demo created

$ helm install cluster-1 yugabytedb/yugabyte \
    --namespace yb-demo \
    --set serviceMonitor.enabled=true \
    --set serviceMonitor.extraLabels.release=prom
If you are using Minikube, refer to this documentation section and add the resource requirements accordingly.
To check the status of all the pods from the yb-demo namespace, execute the following command. Wait till all the pods have a Running status.
$ kubectl get pods --namespace yb-demo
What is a ServiceMonitor?
Similar to a Pod or Deployment, ServiceMonitor is also a resource which is handled by the Prometheus Operator. The ServiceMonitor resource selects a Kubernetes Service based on a given set of labels. With the help of this selected Service, Prometheus Operator creates scrape configs for Prometheus. Prometheus uses these configs to actually scrape the application pods.
The ServiceMonitor resource can have all the details like port names or numbers, scrape interval, HTTP path where application is exposing the metrics and so on. In the case of the yugabytedb/yugabyte Helm chart, it creates ServiceMonitors for YB-Master as well as YB-TServer pods. Take a look at the API reference document for more information.
To make sure that Prometheus is configured correctly, port-forward to the Prometheus pod and visit https://localhost:9090/targets
$ kubectl port-forward \
    prometheus-prom-kube-prometheus-stack-prometheus-0 \
    --namespace monitoring 9090
It should have targets with the name yb-demo/cluster-1-yugabyte-yb-… listed there.
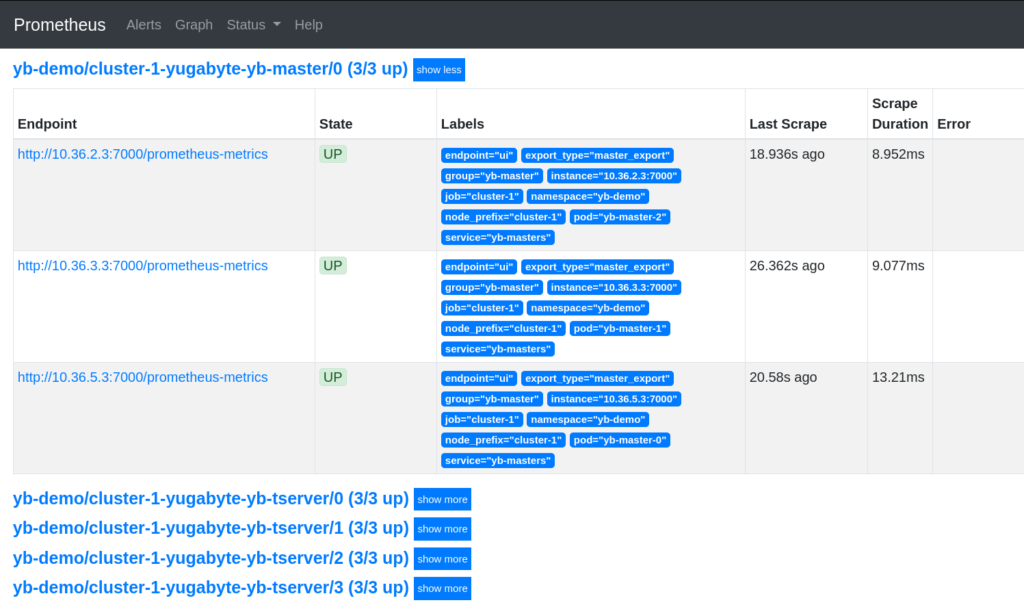
The targets in the above screenshot are folded for brevity.
Accessing the Grafana dashboard
Now that we have our metrics collection working, let’s take a look at the Grafana dashboard to visualize those metrics. The kube-prometheus-stack Helm chart also provisions Grafana for us. The Grafana instance provisioned by kube-prometheus-stack will have above Prometheus added as a data source. It will also have the YugabyteDB Grafana dashboard added by default.
To view the web user interface of Grafana, port-forward to its pod.
$ kubectl port-forward \
    $(kubectl get pods -l app.kubernetes.io/name=grafana -n monitoring -o name) \
    --namespace monitoring 3000
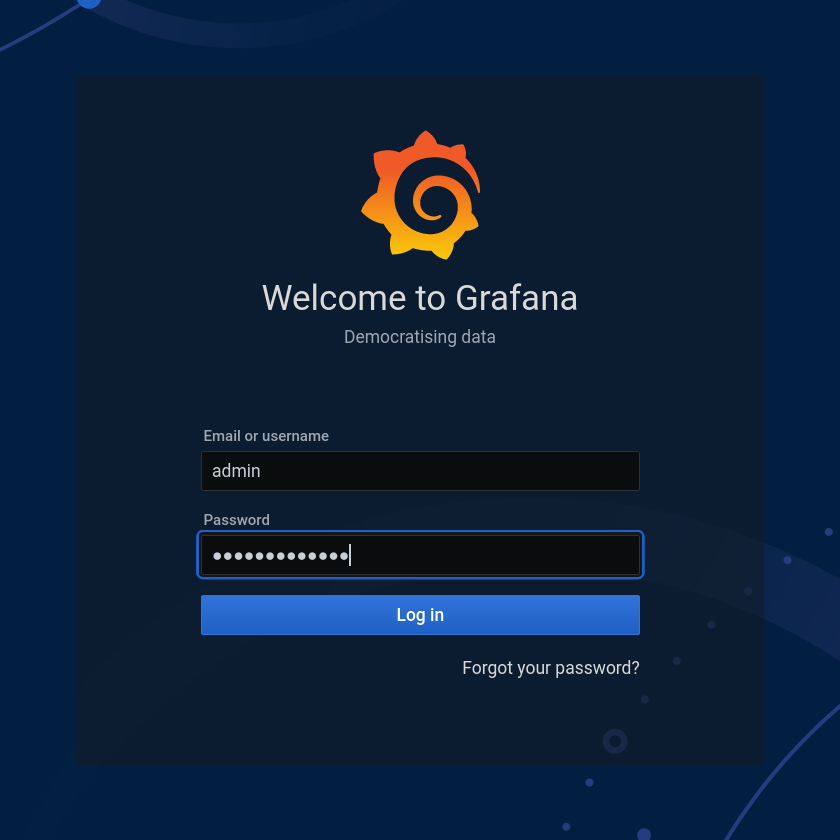
Visit the Grafana user interface at https://localhost:3000 and login with the credentials admin / prom-operator.
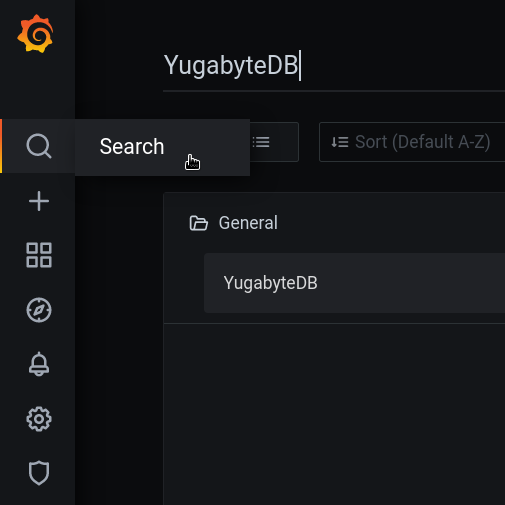
To view the YugabyteDB dashboard, search for the word ‘YugabyteDB’ by going to the ‘Search’ menu on the left (the magnifying glass icon).
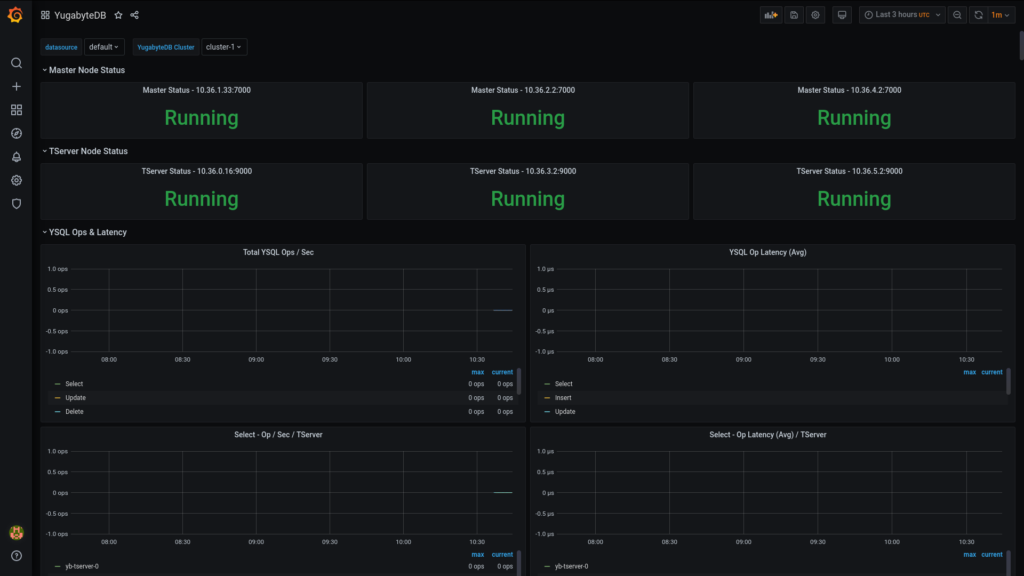
The dashboard should look something similar to this:
Running client workload
We saw the Grafana dashboard, but it was almost blank. To get more metrics from YugabyteDB, we will run some client workload on it. We will be using the YugabyteDB workload generator to do so.
The following commands will create workload generator pods which will try to insert and retrieve some data on both the YCQL and YSQL layers.
$ kubectl run --restart Never \
    --image yugabytedb/yb-sample-apps \
    --namespace yb-demo \
    java-client-sql -- \
     --workload SqlInserts \
     --nodes yb-tserver-service.yb-demo.svc.cluster.local:5433 \
     --num_threads_write 4 \
     --num_threads_read 6

$ kubectl run --restart Never \
    --image yugabytedb/yb-sample-apps \
    --namespace yb-demo \
    java-client-cql -- \
     --workload CassandraKeyValue \
     --nodes yb-tserver-service.yb-demo.svc.cluster.local:9042 \
     --num_threads_write 4 \
     --num_threads_read 6
Check if both workload generator pods are running:
$ kubectl get pods --namespace yb-demo --selector run
Delete all the workload generator pods after 5 minutes and visit the Grafana user interface at https://localhost:3000.
$ kubectl delete pods \
    java-client-sql java-client-cql \
    --namespace yb-demo

$ kubectl port-forward \
    $(kubectl get pods -l app.kubernetes.io/name=grafana -n monitoring -o name) \
    --namespace monitoring 3000
The graph panels should look something similar to these:
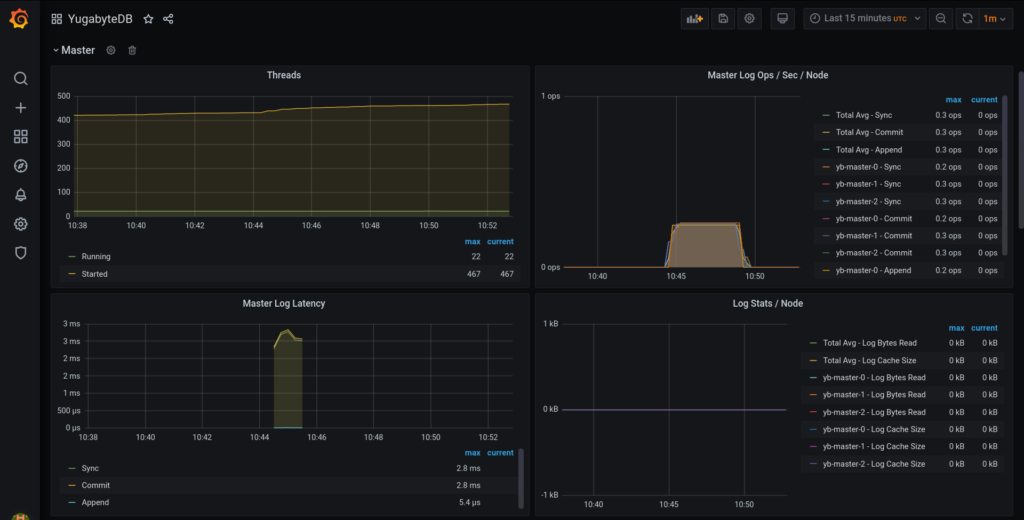
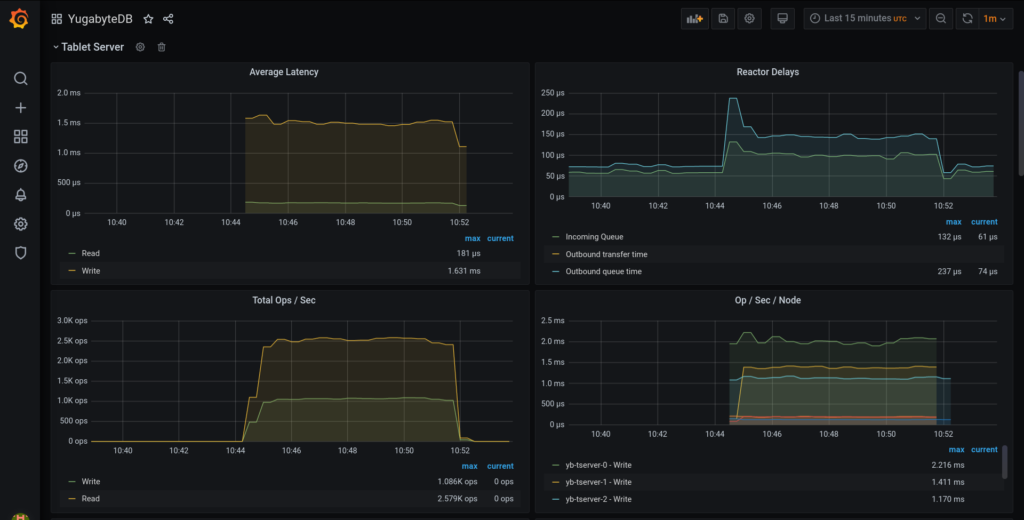
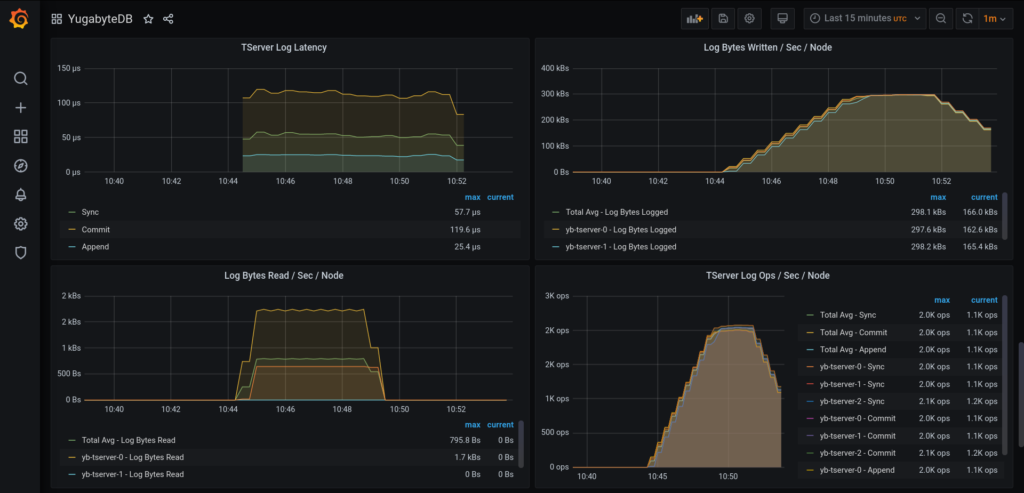
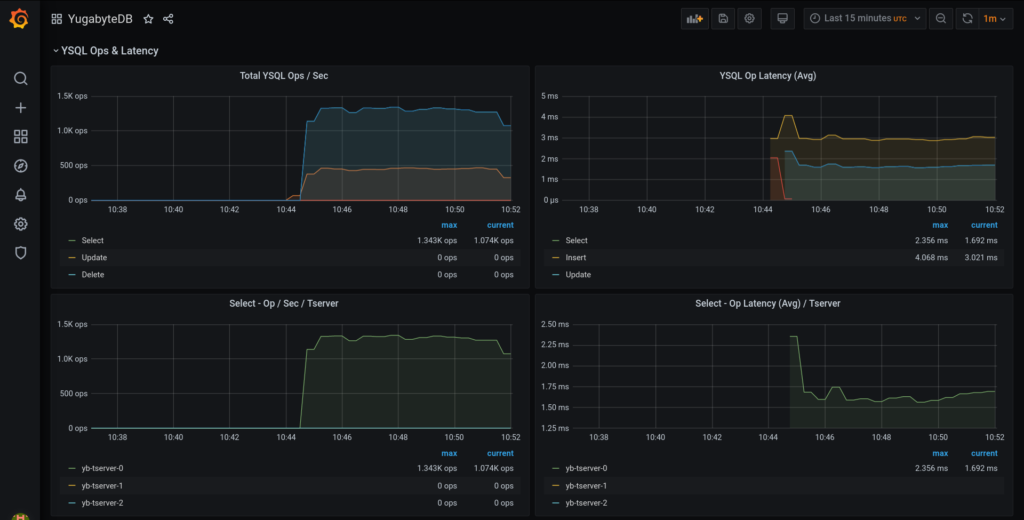
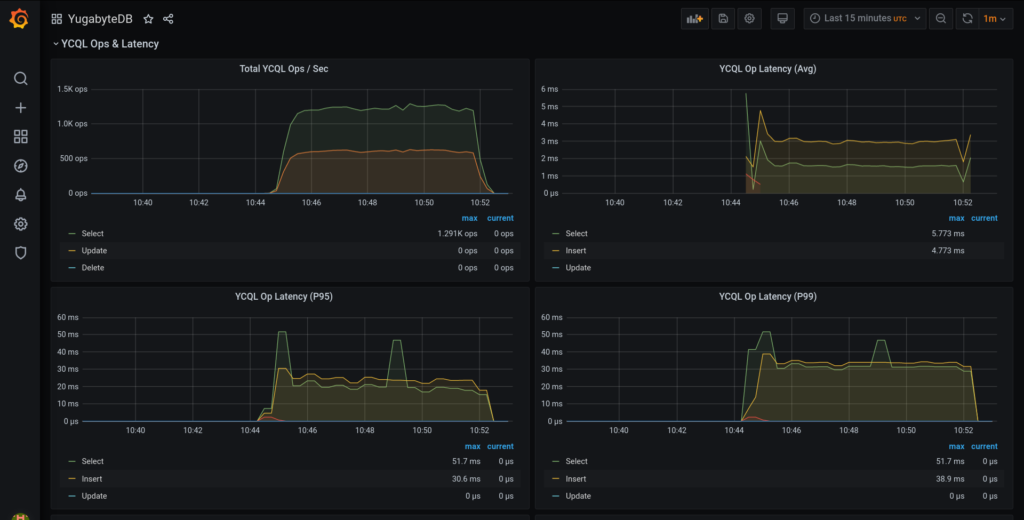
You can pick up the panels which are relevant to you and create your own dashboard as required.
(Optional) Cleaning up the resources
To delete all the resources which we created as part of this post, run the following commands. These include Helm releases of YugabyteDB and the Prometheus Operator as well as the volumes created by the yugabyte chart.
$ helm delete cluster-1 --namespace yb-demo
release "cluster-1" uninstalled

$ kubectl delete pvc --namespace yb-demo --selector chart=yugabyte,release=cluster-1
…
persistentvolumeclaim "datadir0-yb-master-2" deleted
persistentvolumeclaim "datadir0-yb-tserver-2" deleted

$ helm delete prom --namespace monitoring
release "prom" uninstalled
Conclusion
That’s it! You now have a YugabyteDB cluster running on Kubernetes, with Prometheus and Grafana to monitor it.
In this blog post, we showed you how you can use the Prometheus Operator for monitoring YugabyteDB. We walked you through the steps of configuring and deploying kube-prometheus-stack Helm chart and accessing the YugabyteDB Grafana dashboard. The Prometheus Operator makes it very convenient to provision and maintain Prometheus on Kubernetes.


