Scaling YugabyteDB to Millions of Reads and Writes
Here at Yugabyte, we continuously push the limits of the systems we build. As a part of that, we ran some large cluster benchmarks to scale YugabyteDB to million of reads and writes per second while retaining low latencies. This post goes into the details about our 50-node cluster benchmark. We posted the results of the benchmark on a 25 node cluster in our community forum.
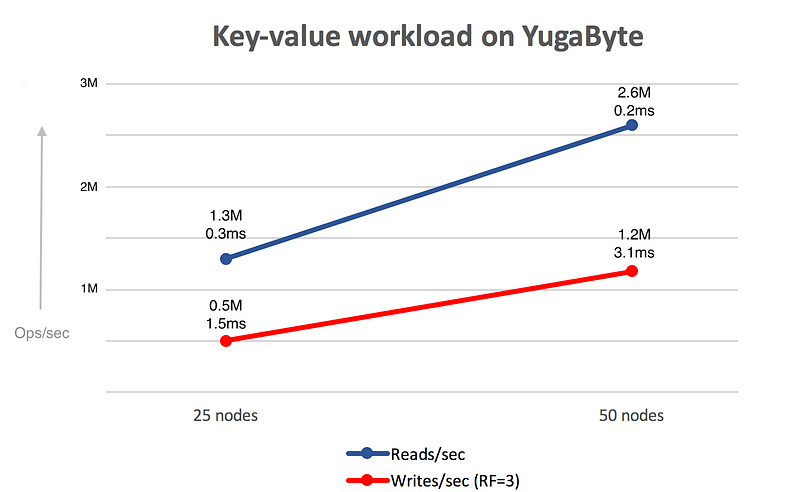
The graph above shows how you can achieve linear scalability with YugabyteDB. The read and write throughput doubles when the cluster size doubles from 25 to 50 nodes, while the latencies remain low in the order of couple ms. If you are interested in the details of how reads and writes work, read all about the YugaByte IO operations as well as the architecture in our detailed documentation.
This test was performed in Google Cloud Platform. Since YugabyteDB is a cloud-native database, it can deliver similar performance outcomes on other public clouds as well as on-premise data centers. You can install and try YugabyteDB out by following these simple Quick Start instructions — it only takes a few minutes.
In the sections below, we dive deeper into the experimental setup and the details of the read and write performance metrics.
Setup
Here is the benchmark setup.
- 50 compute instances in Google Cloud Platform
- Each instance is a n1-standard-16 type with:
**16 virtual CPUs
** Intel® Xeon® CPU @ 2.20GHz
** 60GB RAM
** 2 x 375 GB direct attached SSD
- Replication factor (RF) = 3
- YugabyteDB version: 0.9.1.0. All configuration parameters are default on the YugabyteDB nodes.
The workload was generated using a multi-threaded Cassandra key-value sample application that was run from n1-highcpu-32 machines. The key and value sizes used were 40 and 16 bytes respectively.
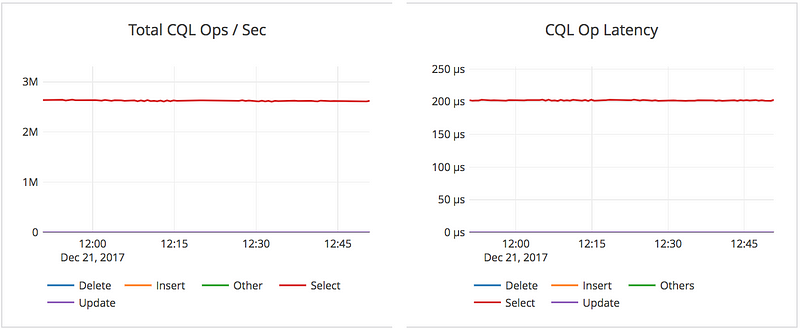
YugabyteDB performs strongly consistent reads by default. The read IO path is documented in detail in our docs. Below is the summary of the performance metrics observed during a 100% read workload:
- 2.6M read ops/sec, sum across the YugaByte nodes.
- 0.2ms average latency per read on the server side.
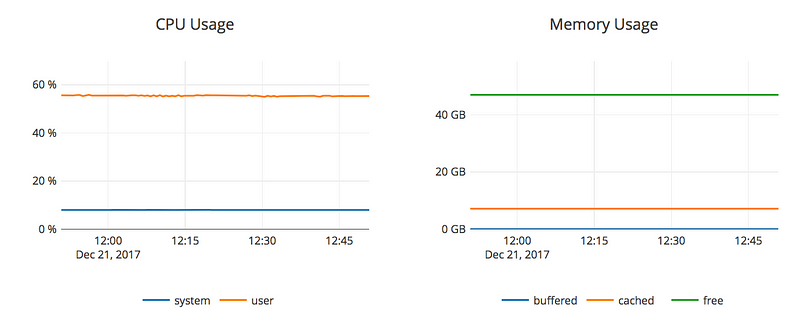
- 65% CPU usage, averaged across the YugaByte nodes.
The graphs below were captured for one hour of the run. The ops/sec is the sum across all the nodes while the latency is the average. Note that the throughput and latency metrics are very steady over the entire time window.
The two graphs below show the corresponding CPU and RAM usage during that time interval.
Writes
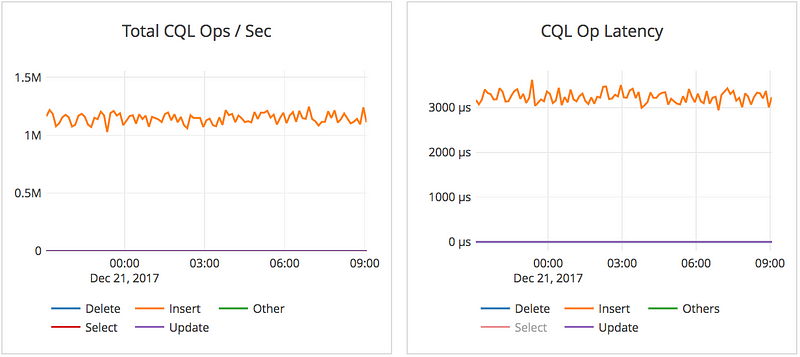
YugaByte performs strongly consistent writes, with a replication factor of 3 in this case. Here is detailed information of the write IO path in our docs. Below is the summary of the performance metrics observed during a 100% write workload:
- 1.2M write ops/sec , sum across the YugaByte nodes.
- 3.1ms average latency per write op on the server side.
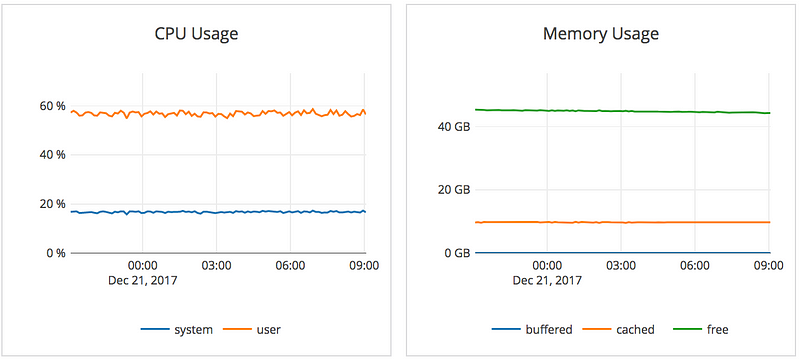
- 75% CPU usage on average across the YugaByte nodes.
The graphs below are for twelve hours of the run. Note that this is a much longer time interval than the read benchmark because performance issues in writes often show up after a while of running when latency spikes due to background flushes and compaction start to show up.
The two graphs below are the corresponding CPU and RAM usage for those twelve hours, and are the average across all the YugaByte nodes.
Note that these writes are the logical writes that the app issued. Each write is replicated three times internally by the database using the RAFT protocol (since RF=3).
What’s Next?
In this blog post, we presented YugabyteDB’s ability to get linear scale-out going from 25 nodes to 50 nodes. Stay tuned for results with larger cluster sizes.
Note that YugabyteDB supports the Redis API with similar high performance as well — try out the Redis-as-a-DB. We also welcome you to visit our github repo to try out more experiments on local setup. Once you’ve tried to set up a local cluster and tested your favorite application, feel free to post your feedback and suggestions on the YugaByte Community Forum. We look forward to hearing from you!


