Bringing Truth to Competitive Benchmark Claims – YugabyteDB vs CockroachDB, Part 2
In part 1 of this blog series, we highlighted multiple factual errors in the Cockroach Labs analysis of YugabyteDB. In this second post we provide the next layer of detail behind YugabyteDB’s architecture, with an emphasis on comparing it to that of CockroachDB’s.
Contents of this post
- TLDR
- Query layer – reusing PostgreSQL
- Storage layer – engineered for performance at scale
- A deep dive into performance at large data sizes
- Results at a glance
- Take one – loading 1 billion rows with 64 threads
- CockroachDB: data load slowdown with data size increase
- Using multiple disks for a single large table
- Ranges vs tablets – architectural differences
- Impact of compactions on query performance
- YugabyteDB: 1B data load completed successfully
- Backpressure user requests when overloaded
- Take two – loading 450 million rows with 32 threads
- Detailed YCSB results
- Understanding performance in distributed SQL
- Conclusion
TLDR
Yugabyte SQL is based on a reuse of PostgreSQL’s native query layer. This reuse retains many of the most advanced RDBMS features in PostgreSQL so that application development velocity remains uncompromised. On the other hand, CockroachDB is far from becoming the complete RDBMS that PostgreSQL is today. Attempting to be wire compatible with PostgreSQL v9.6 is a good starting point, but not sufficient to serve the breadth and depth of relational workloads currently served by PostgreSQL or other mature relational databases.
Additionally, YugabyteDB’s DocDB (RocksDB-based storage layer) is engineered from the ground up with high performance as an explicit design goal especially for large-scale workloads. Smart load balancing across multiple disks, separating compaction queues to reduce read amplification, backpressuring writes when the system is overloaded to maintain good read performance, and enabling multiple RocksDB instances to work together efficiently on a single node are examples of design decisions that lead to higher performance characteristics. On the other hand, CockroachDB performs poorly for large-scale workloads because of its simplistic design choices at the storage layer. Examples of such choices include multiplexing the physical storage of multiple unrelated ranges into a single RocksDB instance as well as frequent resource-intensive range splitting operations (given the max range size of only 64MB).
We have proven that Yugabyte SQL outperforms CockroachDB by delivering 3x higher throughput and 4.5x lower latency on average using YCSB tests based on a 1.35TB dataset having 450M rows. Furthermore, CockroachDB failed to load a 3TB data set with 1B rows in a reasonable amount of time while Yugabyte SQL faced no such issue. Details including reproduction docs are provided in the performance deep dive section below.
Query layer – reusing PostgreSQL
Cockroach Labs’ analysis points out repeatedly that reusing PostgreSQL is the primary reason behind YugabyteDB’s architectural issues, which is a completely false statement. There are numerous advantages to reusing PostgreSQL. We will highlight a few of them in this section. The details are outlined in a separate blog post specifically on why we reused the PostgreSQL query layer in YugabyteDB.
YugabyteDB reuses the upper half of PostgreSQL, while replacing the storage layer of PostgreSQL with a distributed storage layer called DocDB. This is shown in the figure below, with monolithic PostgreSQL on the left, distributed YugabyteDB on the right.
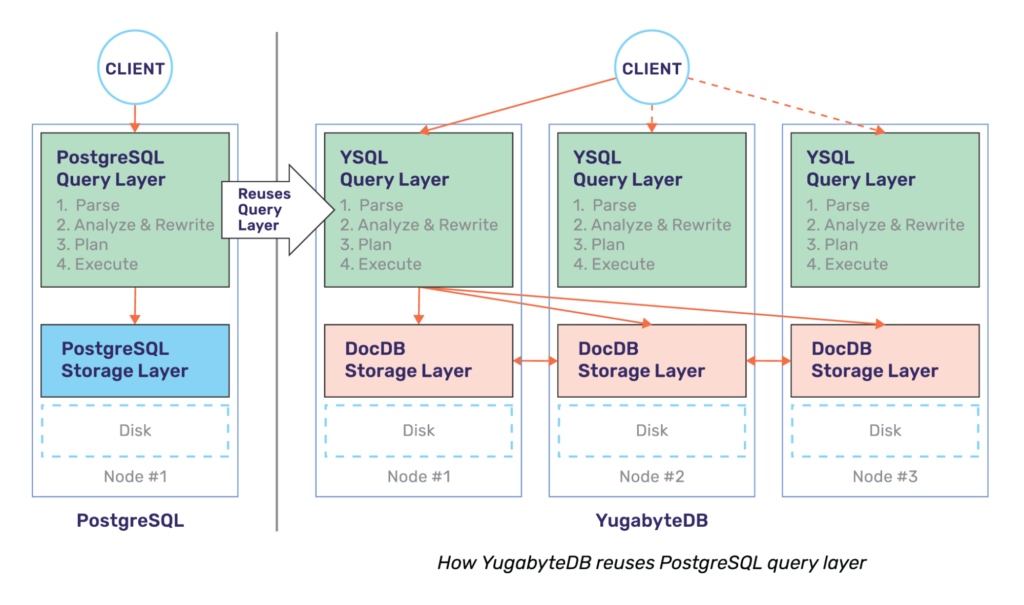
The single biggest advantage of this approach is the fact that YugabyteDB gets to leverage advanced RDBMS features that are well designed, battle-tested, and already documented by PostgreSQL. While the work to get these features to work optimally on top of a cluster of YugabyteDB nodes is significant, the query layer does get radically simplified with such an approach.
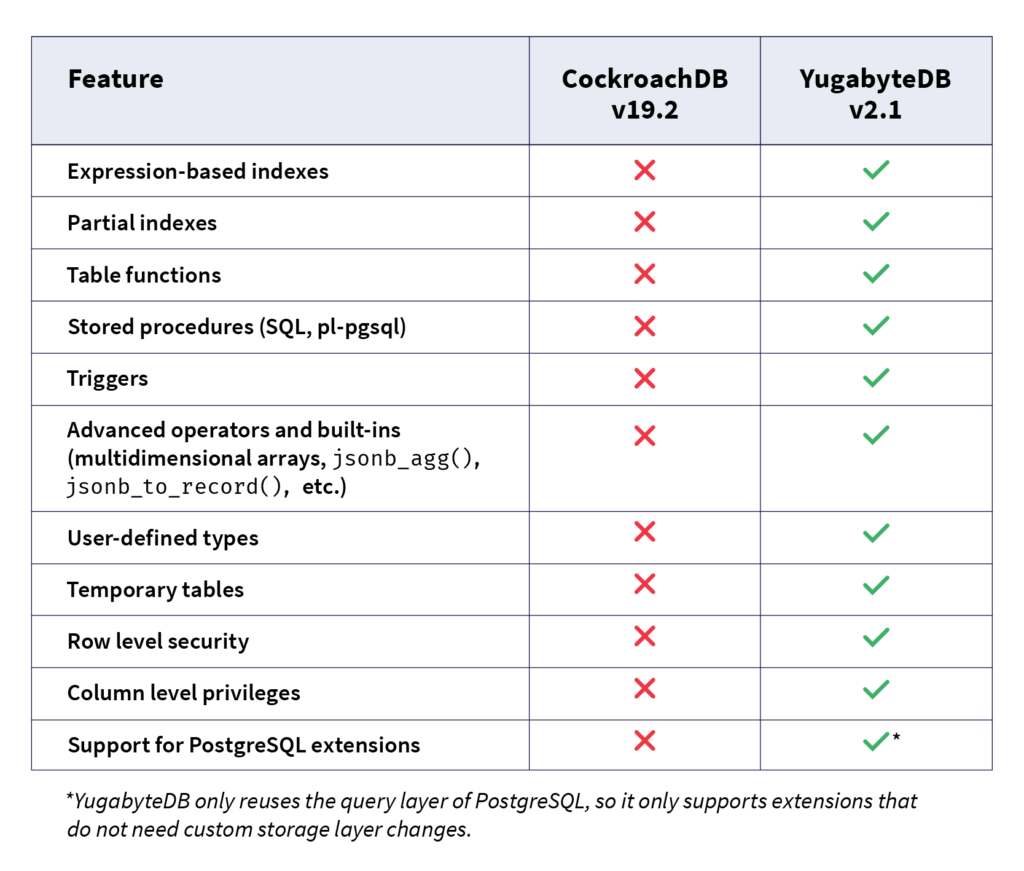
More concretely, let us compare CockroachDB’s choice to rewrite a PostgreSQL-compatible query layer in Go vs. YugabyteDB’s approach of reusing PostgreSQL’s native C++ query layer. In spite of being under development for a shorter period of time, YugabyteDB already supports many more RDBMS features than CockroachDB. Below is a list of features that YugabyteDB supports while CockroachDB does not, some of these are listed in the CockroachDB documentation:
Storage layer – engineered for performance at scale
DocDB, YugabyteDB’s underlying distributed document store, is engineered ground up with the goal of delivering high performance at massive scale. As shown in the figure below, a number of features have been built into DocDB to support this design goal. Note that DocDB uses a heavily customized version of RocksDB for node-local persistence.
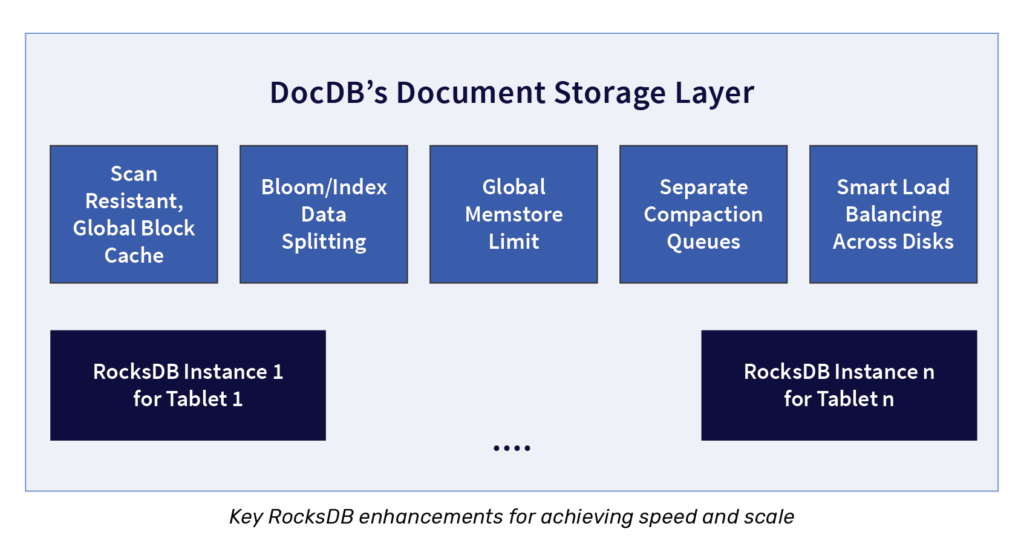
In the performance tests we’ll detail below, we have focused only on some of the DocDB enhancements and architectural decisions. More specifically, we’ll focus on smart load balancing across multiple disks, separating compaction queues to reduce read amplification, and enabling multiple RocksDB instances to work together efficiently on a single node. DocDB adds many other enhancements to RocksDB in order to enable YugabyteDB to achieve high performance at scale. There are other such improvements in the query layer and the global transaction manager, but those topics are a series of posts in themselves.
A deep dive into performance at large data sizes
In this first example, we wanted to do an “apples to apples” comparison that looked at the performance of CockroachDB and YugabyteDB in scenarios with large data sets on disk. In this experiment we used the YCSB benchmark with the standard JDBC binding to load 1 billion rows into a 3-node cluster. We expected the dataset at the end of the data load to cross 1TB on each node (or a 3 TB total data set size in each cluster).
Here are the pertinent details concerning the configuration we tested:
- Both clusters were deployed in AWS us-west-2 region
- CockroachDB v19.2.6
- YugabyteDB v2.1.5 with the YSQL API
- Each cluster had 3 nodes
- Each node was a
c5.4xlarge - Each node had 2 x 5TB SSDs (gp2 EBS)
- The benchmark was run on a range-sharded table in CockroachDB and on YugabyteDB, we used both range and hash. A benchmark using a hash-sharded CockroachDB table was not done because this is not available in a GA release.
- Both databases were run in their default isolation level (CockroachDB using serializable and YugabyteDB using snapshot isolation). Note that CockroachDB supports only the serializable isolation level while YugabyteDB supports both serializable and snapshot isolation.
Results at a glance
Note that all of the results below can be reproduced using these instructions for the YCSB benchmark.
- The data load completed fine for YugabyteDB, while CockroachDB failed to load 1B rows (which is 3TB of data) within a reasonable time. We therefore reset the target to 450M rows, which is about 1.3TB of data.
- When loading the 450M rows using YCSB, YugabyteDB could sustain about 3x higher throughput than CockroachDB.
- We noticed the following performance characteristics on average across the different YCSB workloads on the 450M row data set.
- YugabyteDB had 3x higher throughput than CockroachDB
- YugabyteDB had 7x lower update latency compared to CockroachDB
- YugabyteDB had 2x lower read latency compared to CockroachDB
- CockroachDB throughput and update latency dramatically worsen with increasing data set sizes.
- CockroachDB throughput on a 450M row table was 51% lower than on a 1M row table, while the degradation in YugabyteDB is only 9%.
- CockroachDB update latencies increased by 180% when going from 1M rows to 450M rows, while the update latencies of YugabyteDB increased only by 11%.
- For this particular benchmark setup, whether we used range or hash sharding, the effect on load time, throughput and latency was minimal. This resulted in YugabyteDB beating CockroachDB on these three dimensions, regardless of the sharding scheme.
Take one – loading 1 billion rows with 64 threads
We started running YCSB with a recordcount of 1 billion rows against both databases. This was done using the standard JDBC binding, using 64 threads as shown below.
$ ./bin/ycsb load jdbc -P db.properties -P workloada -threads 64 -s
The -s option in the command above prints out status periodically, including estimated time to load the data. YCSB gave an estimate of about 20 hours to load the data for both CockroachDB and YugabyteDB using range-sharding. Note that for the YSQL hash sharded table case, the use of multiple threads will parallelize the inserts into multiple shards, thereby minimizing any “hotspots”. Ultimately, we were looking for each database to settle on some steady state of throughput.
CockroachDB: data load slowdown with data size increase
We noticed that as more data was loaded into CockroachDB, the write throughput decreased, from about 12K ops/sec to 3.5K ops/sec. Because of this drop in throughput, the initial estimate of 20 hours to load 1 billion rows increased to over 45 hours.

In fact, the total time to load data became a moving target when the throughput continuously decreased. Therefore, we stopped the load at this point and started to look into why CockroachDB was unable to sustain a throughput of 12k ops/sec.
Using multiple disks for a single large table
Our investigation found that CockroachDB was able to effectively utilize only one disk, even though it was supplied with two. The two disks were passed to CockroachDB as parameters in accordance with the docs.
cockroach start <other params>
  --store=/mnt/d0/cockroach --store=/mnt/d1/cockroach
But we found that the load was severely imbalanced between the disks. Here is the output of running a df -h command on each of the data disks across the nodes in the cluster. Notice that one disk is utilized heavily, while the other is barely used at all.
Node1:
/dev/nvme1n1    5.0T  454M  5.0T   1% /mnt/d0   <-- barely used disk
/dev/nvme2n1    5.0T  455G  4.6T   9% /mnt/d1

Node 2:
/dev/nvme1n1    5.0T  455G  4.6T   9% /mnt/d0
/dev/nvme2n1    5.0T  234M  5.0T   1% /mnt/d1   <-- barely used disk

Node 3
/dev/nvme1n1    5.0T  455G  4.6T   9% /mnt/d0
/dev/nvme2n1    5.0T  174M  5.0T   1% /mnt/d1   <-- barely used disk
One of the disks on each node had an order of magnitude fewer SSTable files compared to the other. As an example, on node1, we noticed that /mnt/d0/cockroach had 15 data (SSTable) files while /mnt/d1/cockroach had over 23K SSTable files!
By contrast, YugabyteDB had the following even split of data across the two disks.
Node1:
/dev/nvme1n1    4.9T  273G  4.7T   6% /mnt/d0
/dev/nvme2n1    4.9T  223G  4.7T   5% /mnt/d1

Node 2:
/dev/nvme1n1    4.9T  228G  4.7T   5% /mnt/d0
/dev/nvme2n1    4.9T  268G  4.7T   6% /mnt/d1

Node 3
/dev/nvme1n1    4.9T  239G  4.7T   5% /mnt/d0
/dev/nvme2n1    4.9T  258G  4.7T   6% /mnt/d1
To understand why CockroachDB could not utilize multiple disks well, we turned to the fundamental differences between tablets in YugabyteDB and ranges in CockroachDB.
Ranges vs tablets – architectural differences
In both CockroachDB and YugabyteDB, a table is split into one or more shards. Each row in a distributed table belongs to exactly one of these shards. A shard in CockroachDB is called a range while in YugabyteDB is called a tablet. However, there are some important architectural differences between ranges and tablets, which contributes to the difference we saw in performance.
In CockroachDB, a range is typically 64MB or so in size. This means that for large data sets, the database will have to manage many ranges. In our example of loading a 1.3TB data set into the cluster, there were ultimately 9,223 ranges in the table. The data corresponding to multiple ranges of a table are stored in a single RocksDB instance. This means that the ranges are a purely logical split of the data, and the data belonging to different ranges are multiplexed into the physical storage of a single RocksDB instance. In YugabyteDB, there is no limitation on the size of a tablet. We have users running with tablets over 100GB in size running in production.
Similar to this CockroachDB Forum user, we observed that all the ranges of one table in CockroachDB are multiplexed into a single RocksDB instance on any given node. A single RocksDB instance, however, can utilize only one disk, as per the RocksDB FAQ:
You can create a single filesystem (ext3, xfs, etc) on multiple disks. Then you can run rocksdb on that single file system. Some tips when using disks:
• if using RAID then don’t use a too small RAID stripe size (64kb is too small, 1MB would be excellent).
• consider enabling compaction readahead by specifying ColumnFamilyOptions::compaction_readahead_size to at least 2MB.
• if workload is write-heavy then have enough compaction threads to keep the disks busy
• consider enabling async write behind for compaction
Requiring changes such as creating a single filesystem on disks by using RAID introduces a lot of operational complexity.
The data of each tablet in YugabyteDB is stored in a separate RocksDB instance. The tablets of a table are distributed uniformly across the available disks. This allows YugabyteDB to balance load across disks and leverage them efficiently. In order to make running multiple RocksDB instances per node very efficient, a number of enhancements were required to YugabyteDB’s DocDB storage layer.
Impact of compactions on query performance
Right after loading about 450M rows into CockroachDB, we ran the YCSB Workload C which performs read queries only.
$ ./bin/ycsb run jdbc -P db.properties -P workloadc -threads 128 -s
We noticed that CockroachDB’s throughput was only 8.5K queries per second and the latencies were much higher than expected (p99 latency was 800ms per the graph shown below).
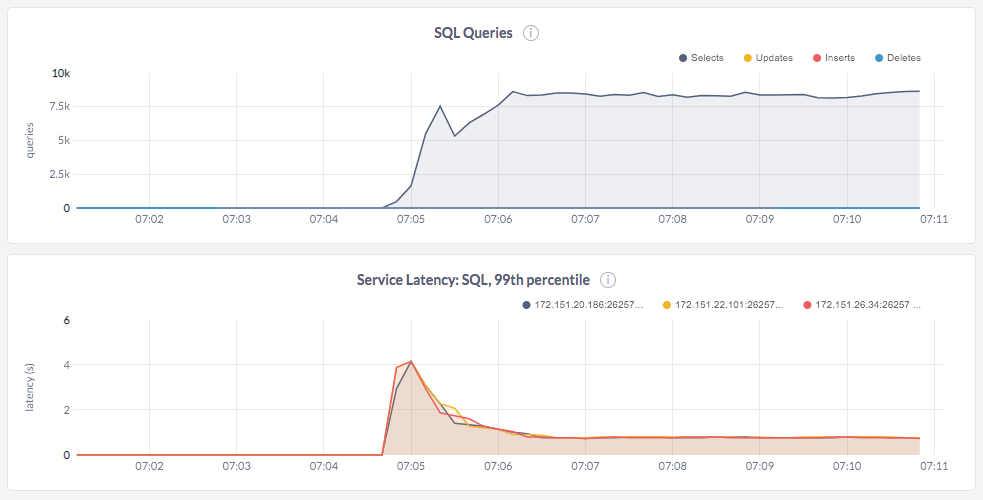
After analyzing a few things about the system, what stood out was the fact that the number of SSTable files had exploded at the end of the load to about 200K files. An SSTable file is a data file created by RocksDB. Since CockroachDB reuses RocksDB for persistence, these files hold the actual data in the ranges across the various tables.

Each SSTable file is created by RocksDB as a part of a process called a memstore flush. Once created, these SSTable files are immutable. This is fundamental to a Log Structured Merge-tree (LSM) store like RocksDB. In order to satisfy a query, RocksDB performs multiple internal reads from one or more of these SSTable files. The higher the number of these internal reads to satisfy any logical query on the table, the worse the performance can be. The number of internal queries to satisfy a logical lookup is called read amplification.
LSM databases run a process called compaction, which merges and replaces multiple SSTable files with a new one continuously in the background thereby decreasing read amplification. In addition to compactions continuously keeping up, read amplification is decreased by using a number of additional techniques. For example, bloom filters are used to probabilistically reduce the number of files that need to be consulted.
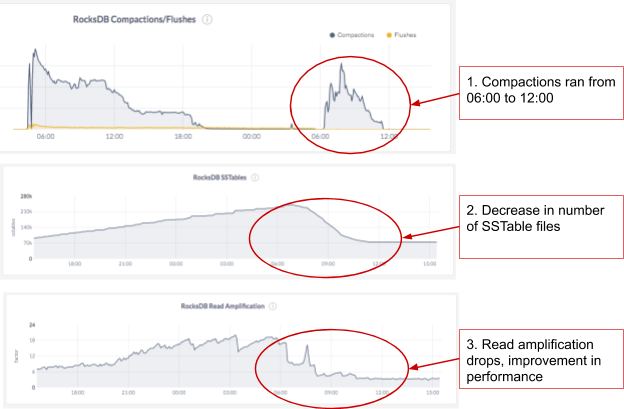
In the case of CockroachDB, the number of SSTable files increases dramatically leading to poor performance even after the data load is completed, because internal read amplification goes up with the increase in the number of SSTable files. This conclusion is supported by the graph below.

The only way out of this situation is to wait for compactions to catch up without any load on the system. We decided to let the compactions settle down by not running any workload on the system. This took about 5-6 hours of keeping the cluster idle without performing any writes or updates. Once the compactions went through, the number of SSTable files decreased and the read amplification dropped as expected. This behavior can be seen in the graphs below.
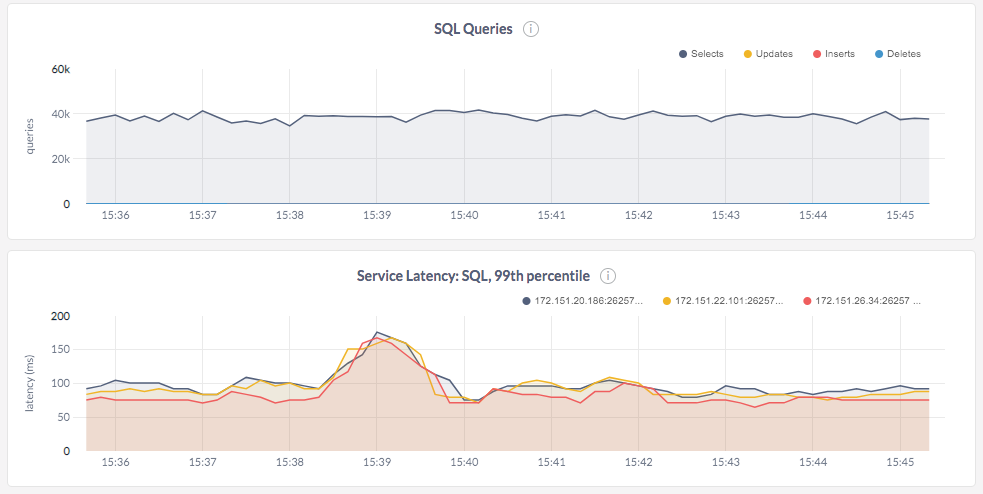
We then ran the read workload and saw better query performance, both in terms of throughput and latency. The cluster was able to do nearly 40K reads/sec. This experiment showed that CockroachDB’s architectural choices and lack of timely compactions have a huge negative impact on read performance.
YugabyteDB: 1B data load completed successfully
In contrast, a 1B row data load completed successfully for YSQL (using a range sharded table) in about 26 hours. The following graphs show the throughput and average latency for the range sharded load phase of the YCSB benchmark during the load phase.
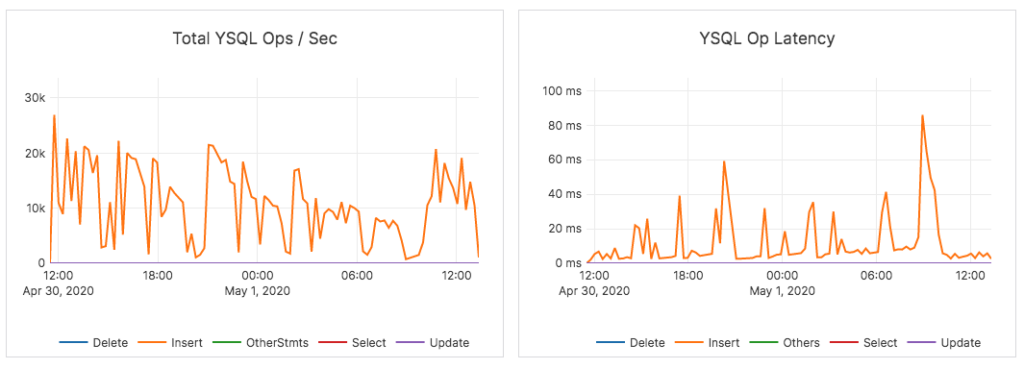
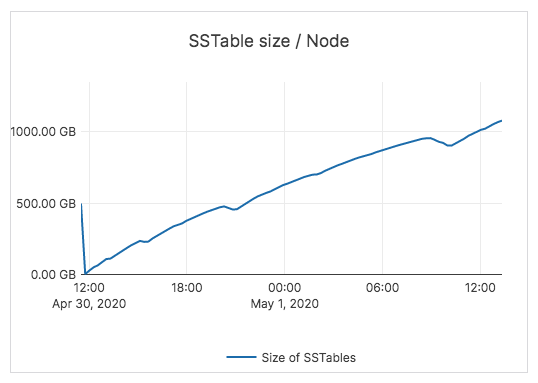
The total dataset was 3.2TB across the two nodes. Each node had just over 1TB of data.
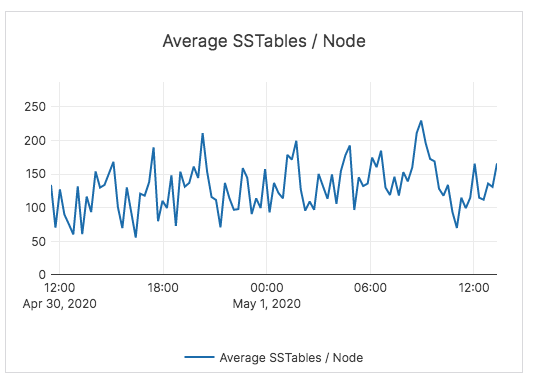
And compactions in YugabyteDB were able to keep pace with the data load thereby maintaining low SSTable file count and read amplification. The number of SSTables in YugabyteDB through the load process is shown below.
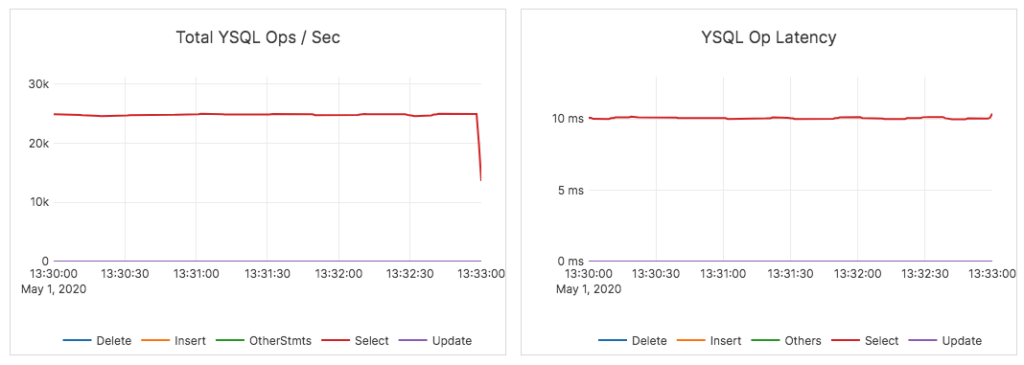
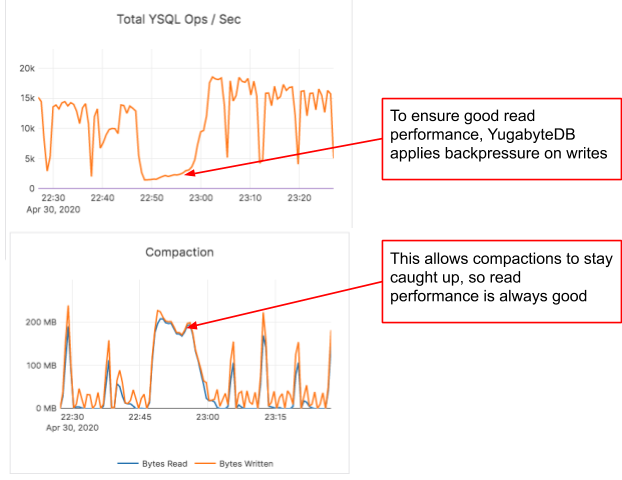
YugabyteDB has been tuned with multiple size-based compaction queues to ensure that the compactions keep up with the incoming write load, and can back pressure ingestion (when needed) to ensure the system performance for read operations does not degrade.
As a result, the read performance of YugabyteDB is consistently high even immediately after the load without having to wait several hours for compactions to finish.
Backpressure user requests when overloaded
The above scenario also shows the importance of slowing down write requests by applying backpressure on the application so that the database is always able to serve read requests with good performance. For example, in the scenario above, the disk becomes a bottleneck for both CockroachDB and YugabyteDB as the data progressively gets loaded. CockroachDB was not able to throttle write requests, which impacted the read performance and the cluster had to be left idle for many hours to recover. By contrast, the load throughput graph of YugabyteDB shows that the database repeatedly applies backpressure on the loader to make sure the read queries would always perform well. The graphs below, which were captured in the load phase, show this in action.
Take two – loading 450 million rows with 32 threads
Since we were unsuccessful in loading 1B rows into CockroachDB in an acceptable amount of time, we decided to reduce the number of rows that needed to be loaded, as well as the number of threads. Since CockroachDB could load ~450 million rows in 24 hours in the previous run, we picked that as the target number of rows to load. This meant that the total data set size after the load would be around 1.35TB as opposed to the original goal of 3TB.
CockroachDB’s data load completed in ~25 hours. We observed that here again its total write throughput decreased from 12K inserts/sec to 3.5K writes/sec as the data load progressed (the latencies were steadily increasing as well, but that matters less in this data load scenario).

In contrast, data load into a hash-sharded YugabyteDB table completed in ~7 hours at around 18K writes per second with an average latency of around 2ms.
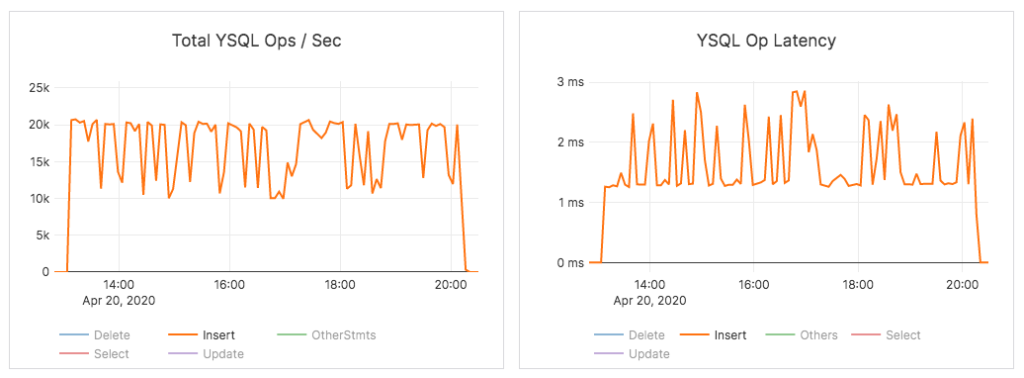
Additionally, data load into the range-sharded YugabyteDB table completed in ~9 hours with 14K ops/sec and 2ms average latency.
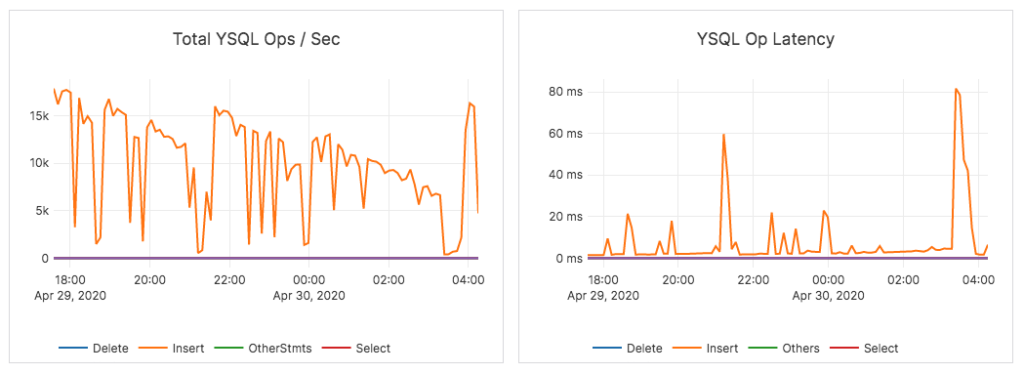
Thus, YugabyteDB was able to make steady progress to load the entire dataset even when dealing with larger scale in terms of data set sizes.
Detailed YCSB results
With the 450M rows loaded, we were able to run the standard YCSB benchmark using the JDBC driver. This section outlines the results of running the benchmark against a CockroachDB range-sharded table (hash sharded tables in CockroachDB are not yet in a stable release) and YugabyteDB range and hash sharded tables.
Loading data
YugabyteDB was able to load data about 3x faster when the scale of data increased to 450M rows. The time to load data is shown in the table below.
| CockroachDB (range) | YSQL (range) | YSQL (hash) | |
|---|---|---|---|
| Time to load 450M rows | 25h 45m 14s | 9h 12m 31s | 7h 9m 25s |
Throughput
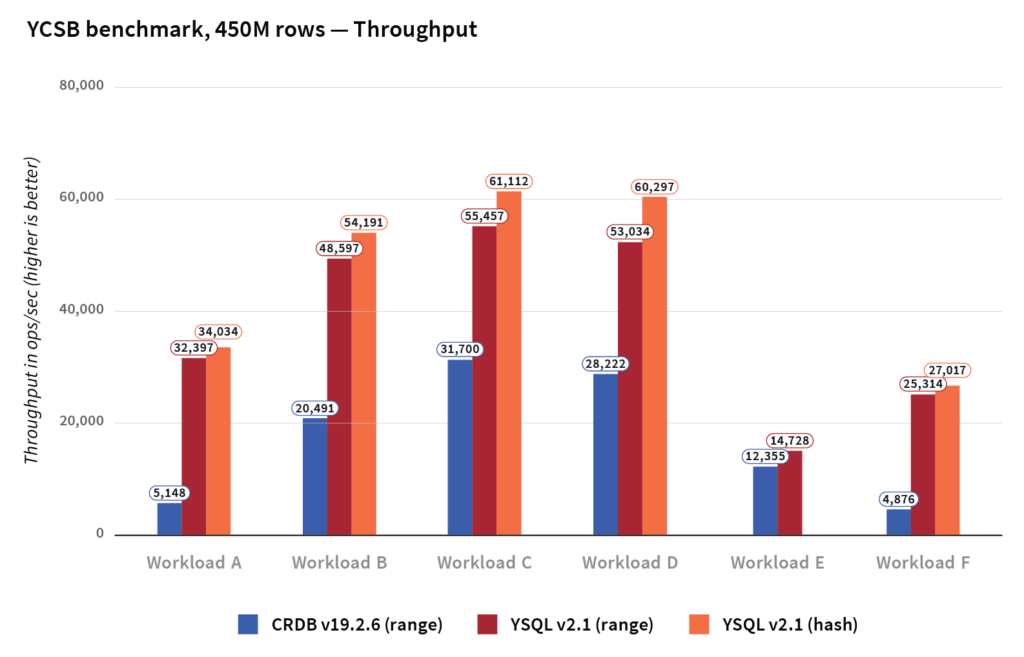
The throughput across the various workloads are shown below. YugabyteDB has on average 3x higher throughput than CockroachDB, and it outperforms CockroachDB in all YCSB workloads in terms of throughput achieved whether using hash or range sharding.
Latency
On average, YugabyteDB had 7x better write/update latency and 2x better read latency compared to CockroachDB.
The latencies across the various update operations are shown in the graph below.
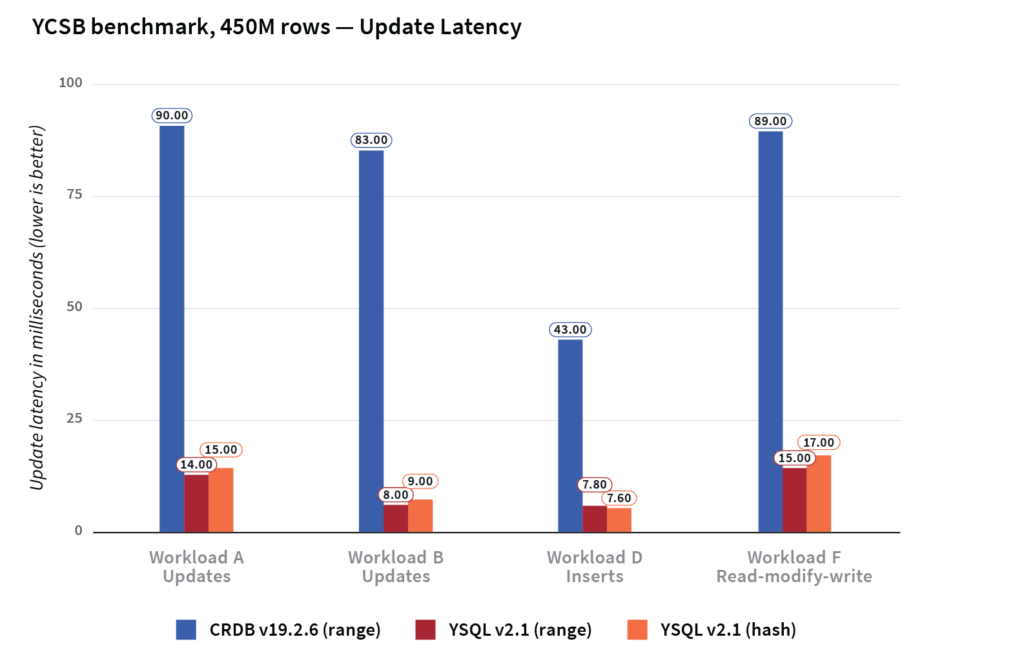
The read latencies across the different workloads are shown below.
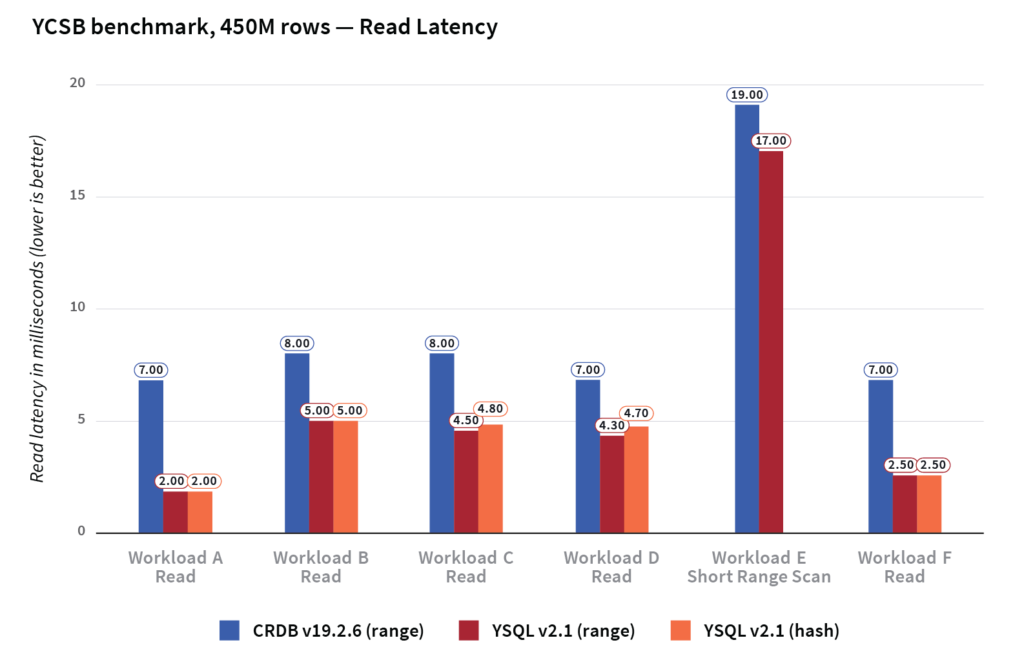
Understanding performance in distributed SQL
Large vs small data sets
The performance characteristics of a database can dramatically differ with the data set size. This is because a number of architectural factors come into play when the data set grows. In this section, we will look at the impact of scaling the data set on the performance of YugabyteDB and CockroachDB using the YCSB benchmark. To get a baseline at a smaller data set size, we ran the standard YCSB benchmark on a data set of just 1M rows against both the databases. The graphs below compare the performance of the databases at 1M and 450M rows.
We noticed that CockroachDB throughput across all the YCSB workloads dropped by 51% when going from 1M to 450M rows, while the corresponding drop in a range sharded YSQL table was only 9%. The graph below summarizes the drop in throughput across the different YCSB workloads when going from 1M rows to 450M rows in the two DBs.
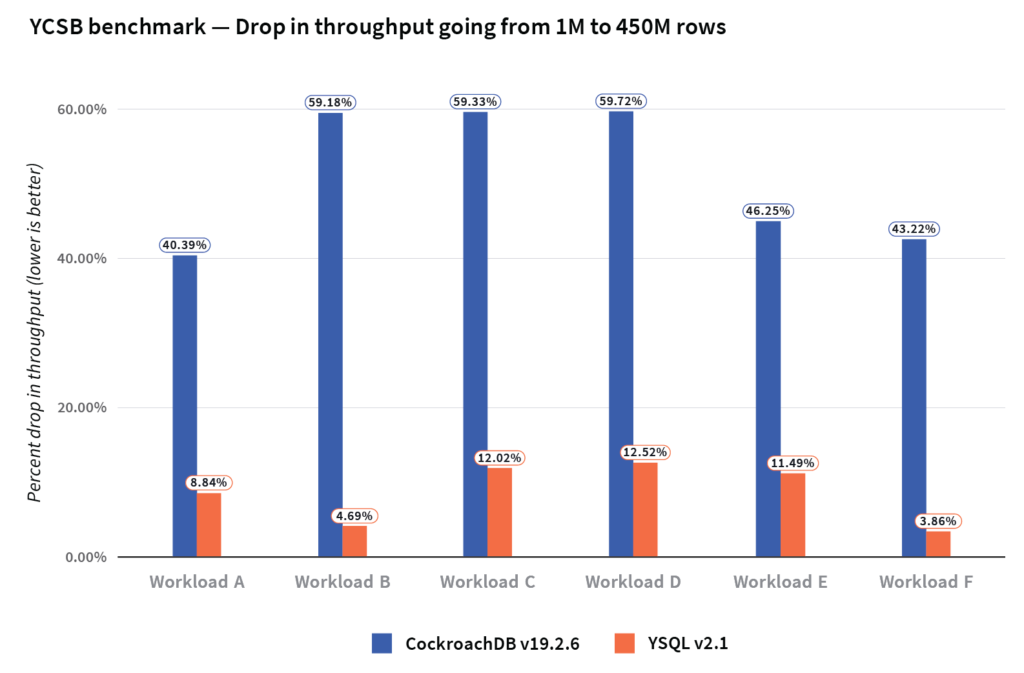
We also noticed that the update latencies of CockroachDB increased by 180% when going from 1M rows to 450M rows, while the update latencies of YugabyteDB increased only by 11%.
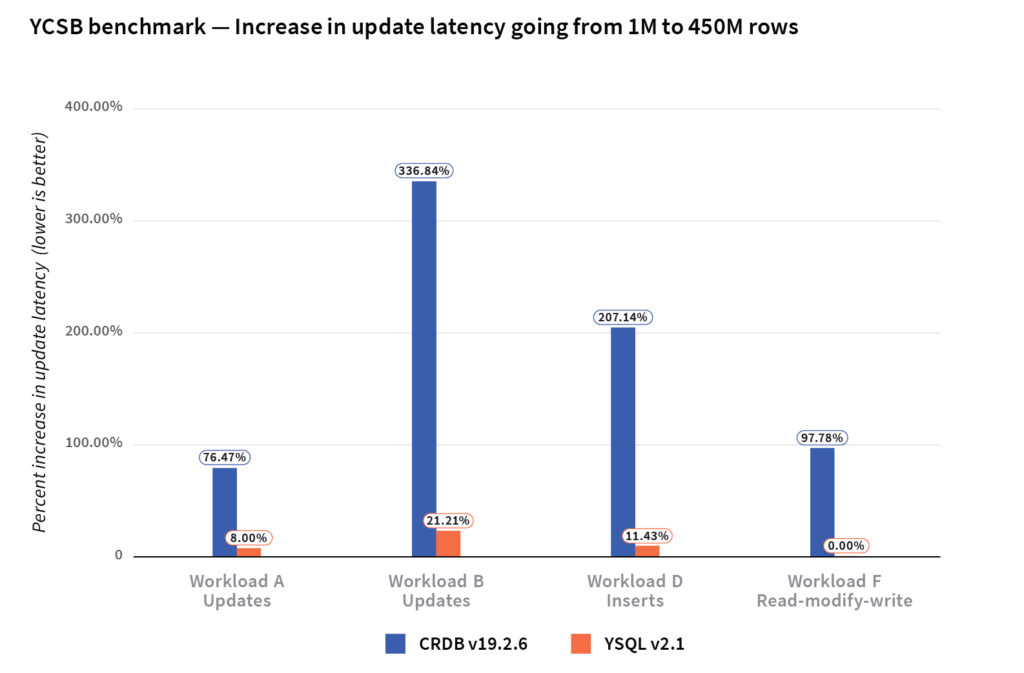
Read latencies for 1M rows and 450M rows did not show any significant difference between both databases.
Range vs hash sharding
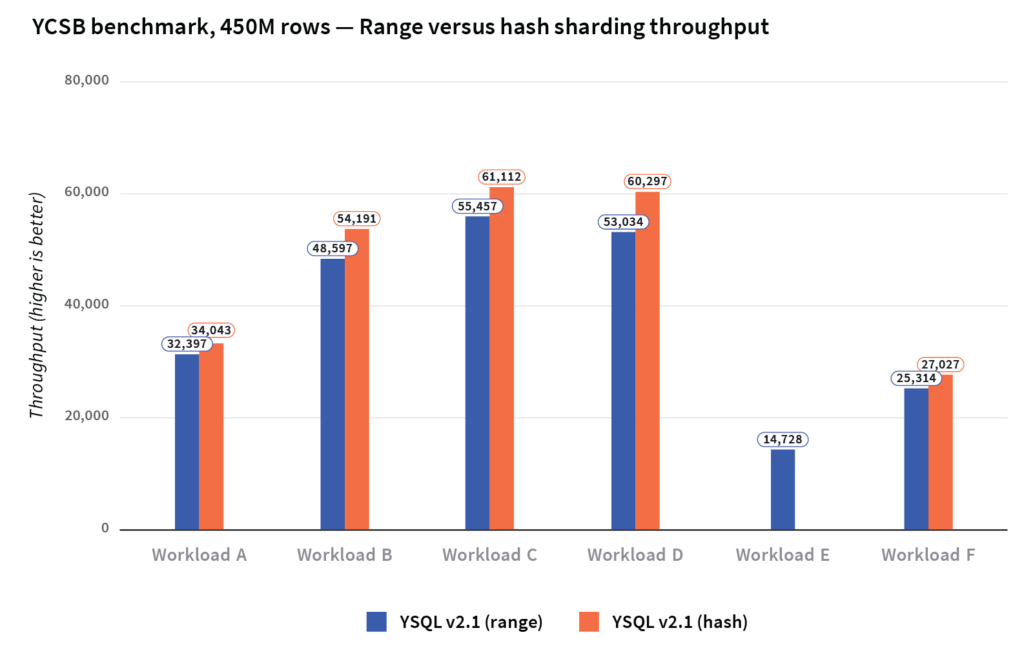
As previously mentioned, YugabyteDB supports both range and hash sharding of tables. The Cockroach Labs analysis claims that range sharding is strictly superior for all SQL workloads. So, what really is the impact on performance between these two types of sharding? We ran the YCSB benchmark against YugabyteDB tables with 450M rows, with both forms of sharding.
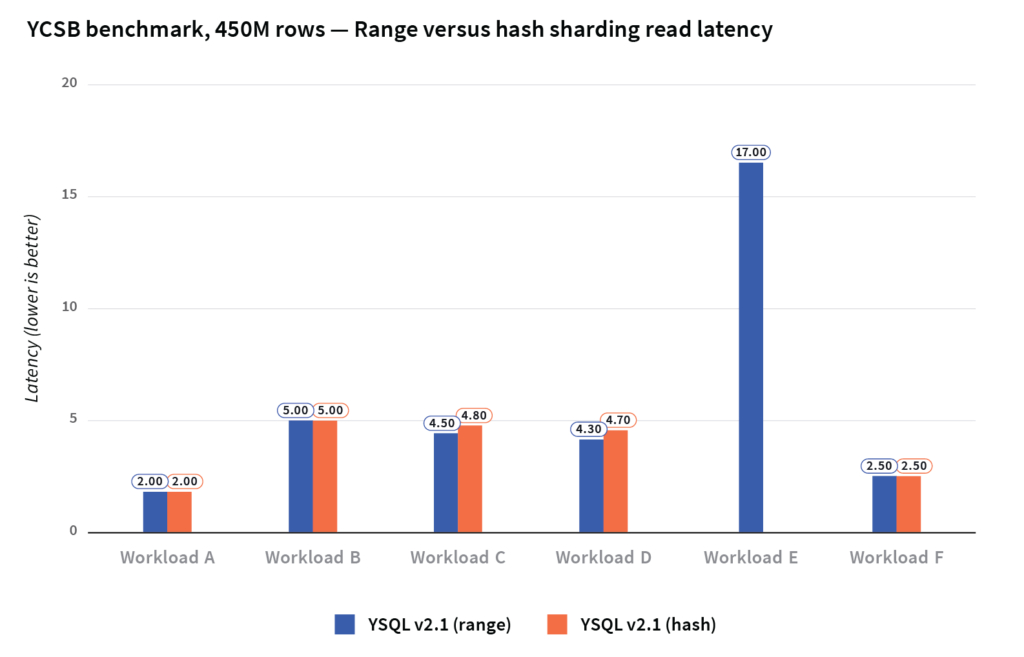
Data loading times are much faster with hash sharding compared to range sharding. Range queries are obviously not efficient in a hash sharded table. For all the other YCSB workloads, whether we used range or hash sharding, the effect on throughput and latency is minimal.
The load times for the YCSB benchmark are shown below. Note that the write throughput of hash sharding can outperform range sharding by a bigger margin in other setups.
| YCSB data load time | ||
| YSQL (range) | YSQL (hash) | |
|---|---|---|
| Time to load 450M rows | 9h 12m 31s | 7h 9m 25s |
The graph below compares the throughput of hash and range sharding across the various YCSB workloads.
The read latencies across these workloads are shown below.
Conclusion
The Cockroach Labs post got a number of aspects about YugabyteDB wrong, leading to the incorrect conclusion of (in their words) “Yugabyte is a monolithic SQL database grafted onto a distributed KV database”. The above analysis sheds light into how YugabyteDB is actually a stronger distributed SQL offering even though it is a newer project than CockroachDB.
We want to take this opportunity to highlight that CockroachDB is missing many of the powerful RDBMS features that users of systems like Oracle/MySQL/PostgreSQL are familiar with. While wire compatibility with PostgreSQL is a nice starting point for a distributed SQL database, significant feature depth is needed in order to win over traditional RDBMS users and that’s what YugabyteDB provides. Additionally, YugabyteDB is built with high performance as one of its core design principles. The YCQL API serves as an example of what the underlying DocDB storage layer is capable of. We are making continuous improvements to YSQL performance with each release to get it on par with YCQL performance.
Building the default RDBMS for the cloud is an ambitious mission full of challenges and opportunities. If this mission is also close to your heart, we welcome you to come build the future with us.

